These classic patterns demonstrate the probability that the current trend may continue or change its direction. They represent consolidation periods that stand out within a clearly defined trend and help traders make informed decisions. In this article, we will look at following most common patterns:
- Flag
- Pennant
- Triangles
- Wedge
- Head & Shoulders
First things first, let’s explore!
Flag
Visually, the pattern looks like a flag on a flagpole. This flagpole indicates the direction of the prevailing trend. A flag is formed as part of a strong trend, due to its sharp change.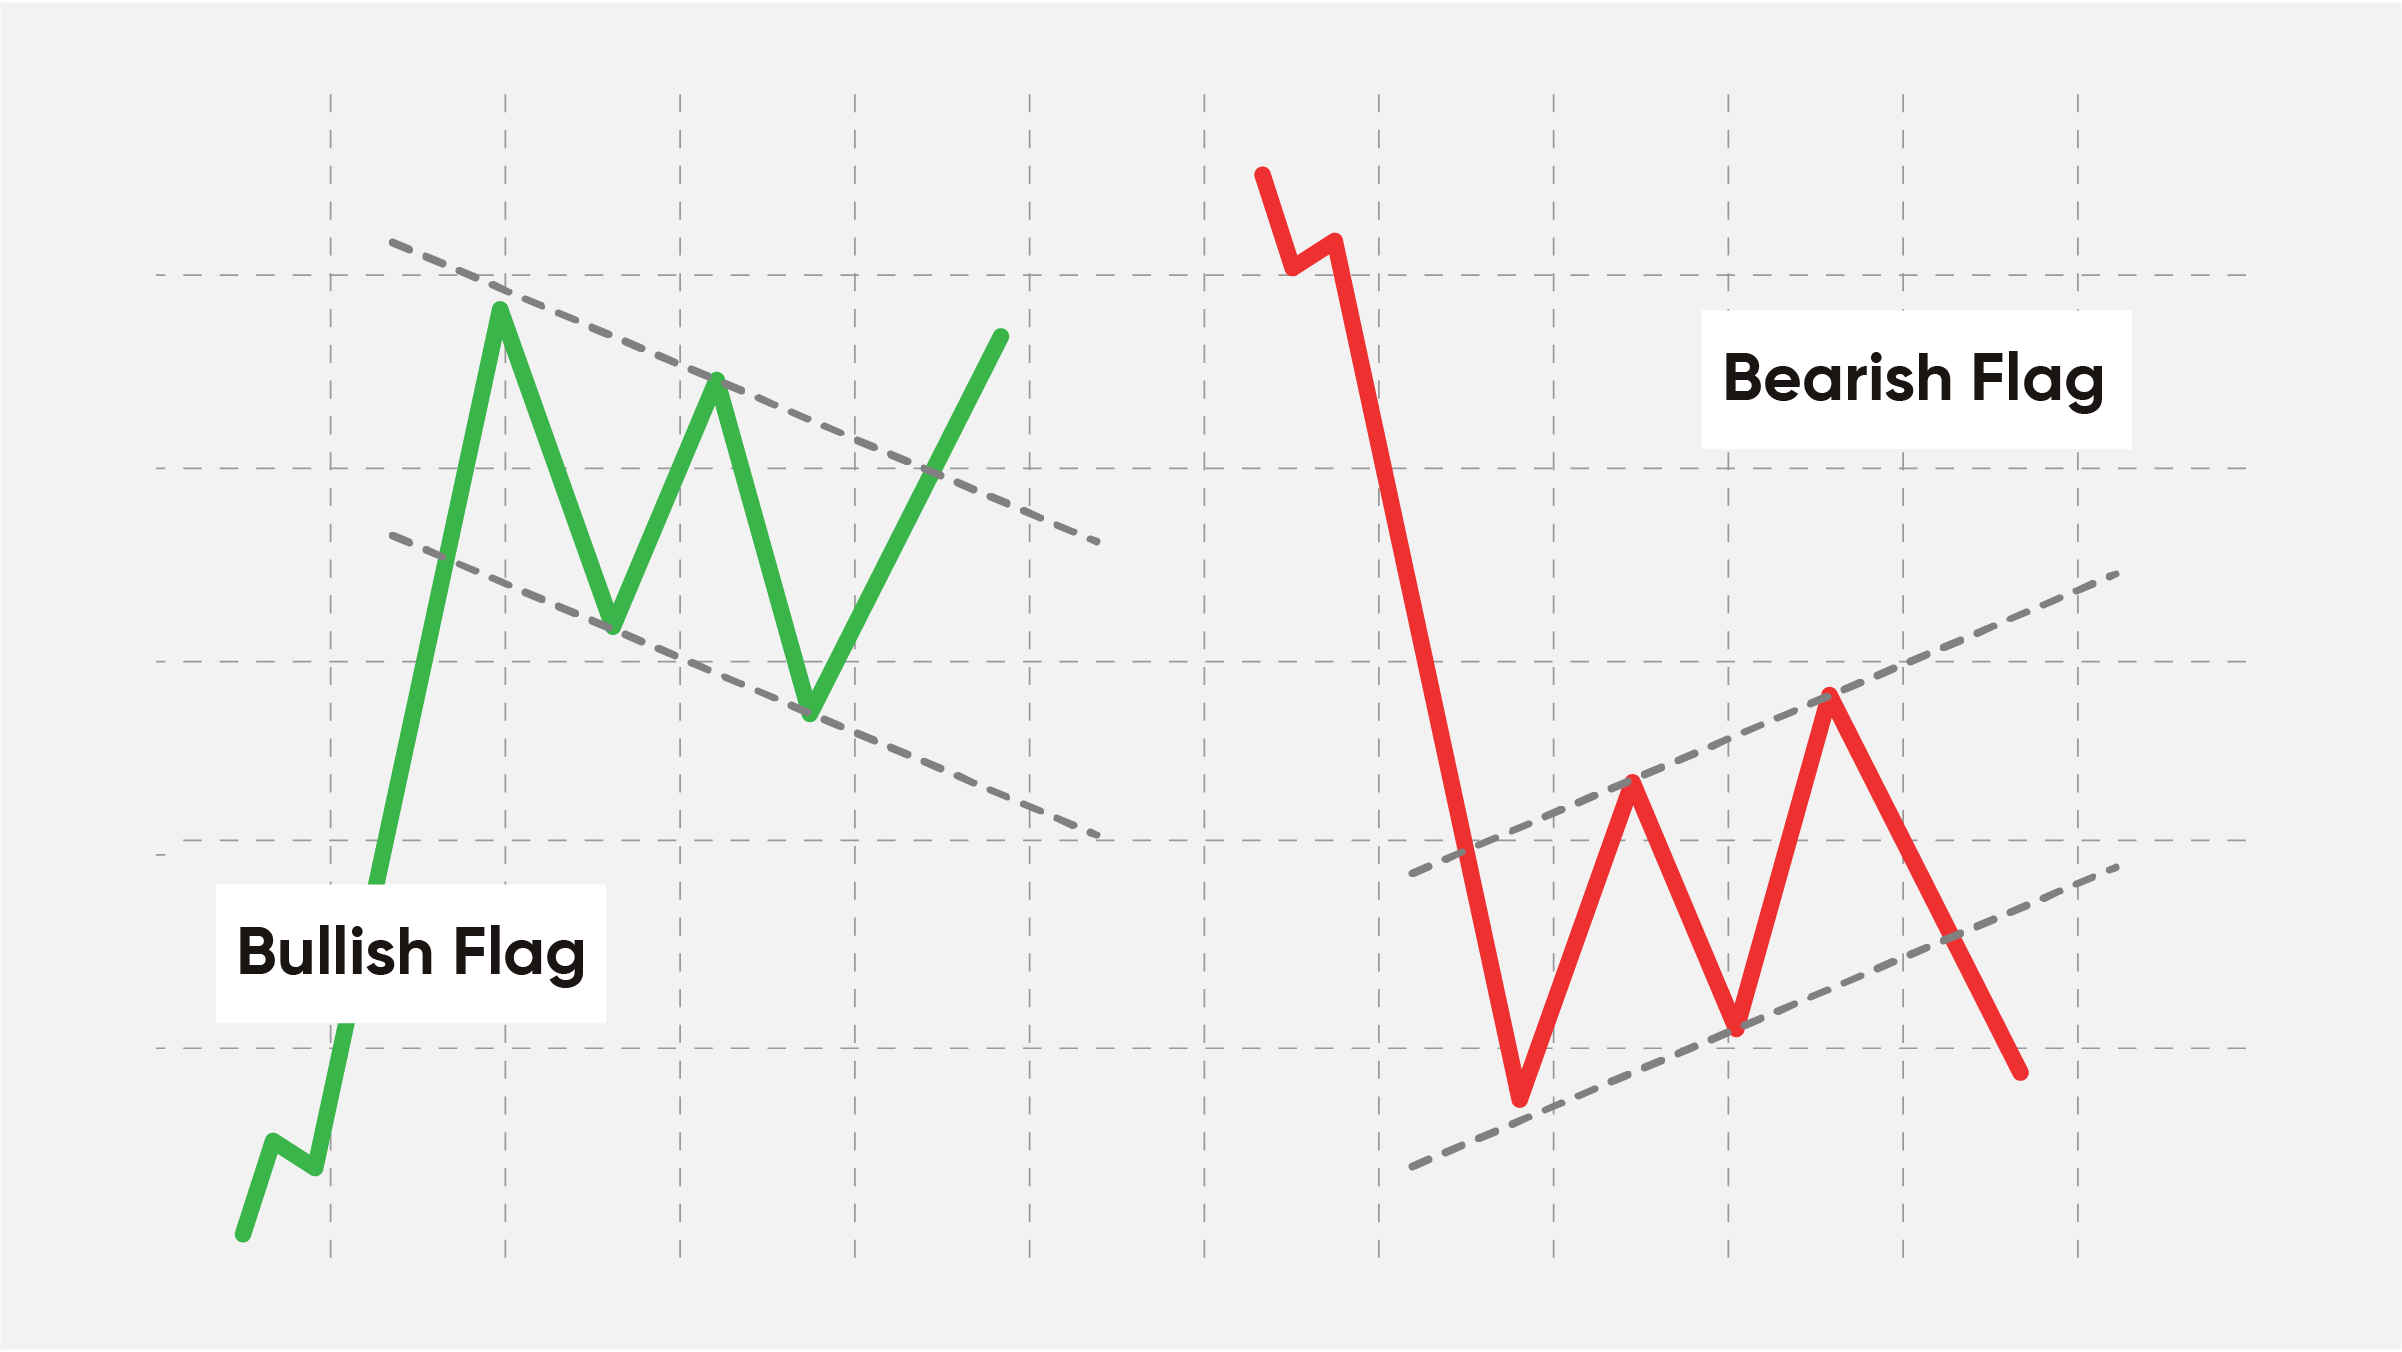
Pennant
The pattern is similar to a flag but has a triangular structure. Pennants appear in the middle of a dominant trend. The difference between a pennant and a flag is that the pennant moves in a narrow range and usually accompanied by low volatility.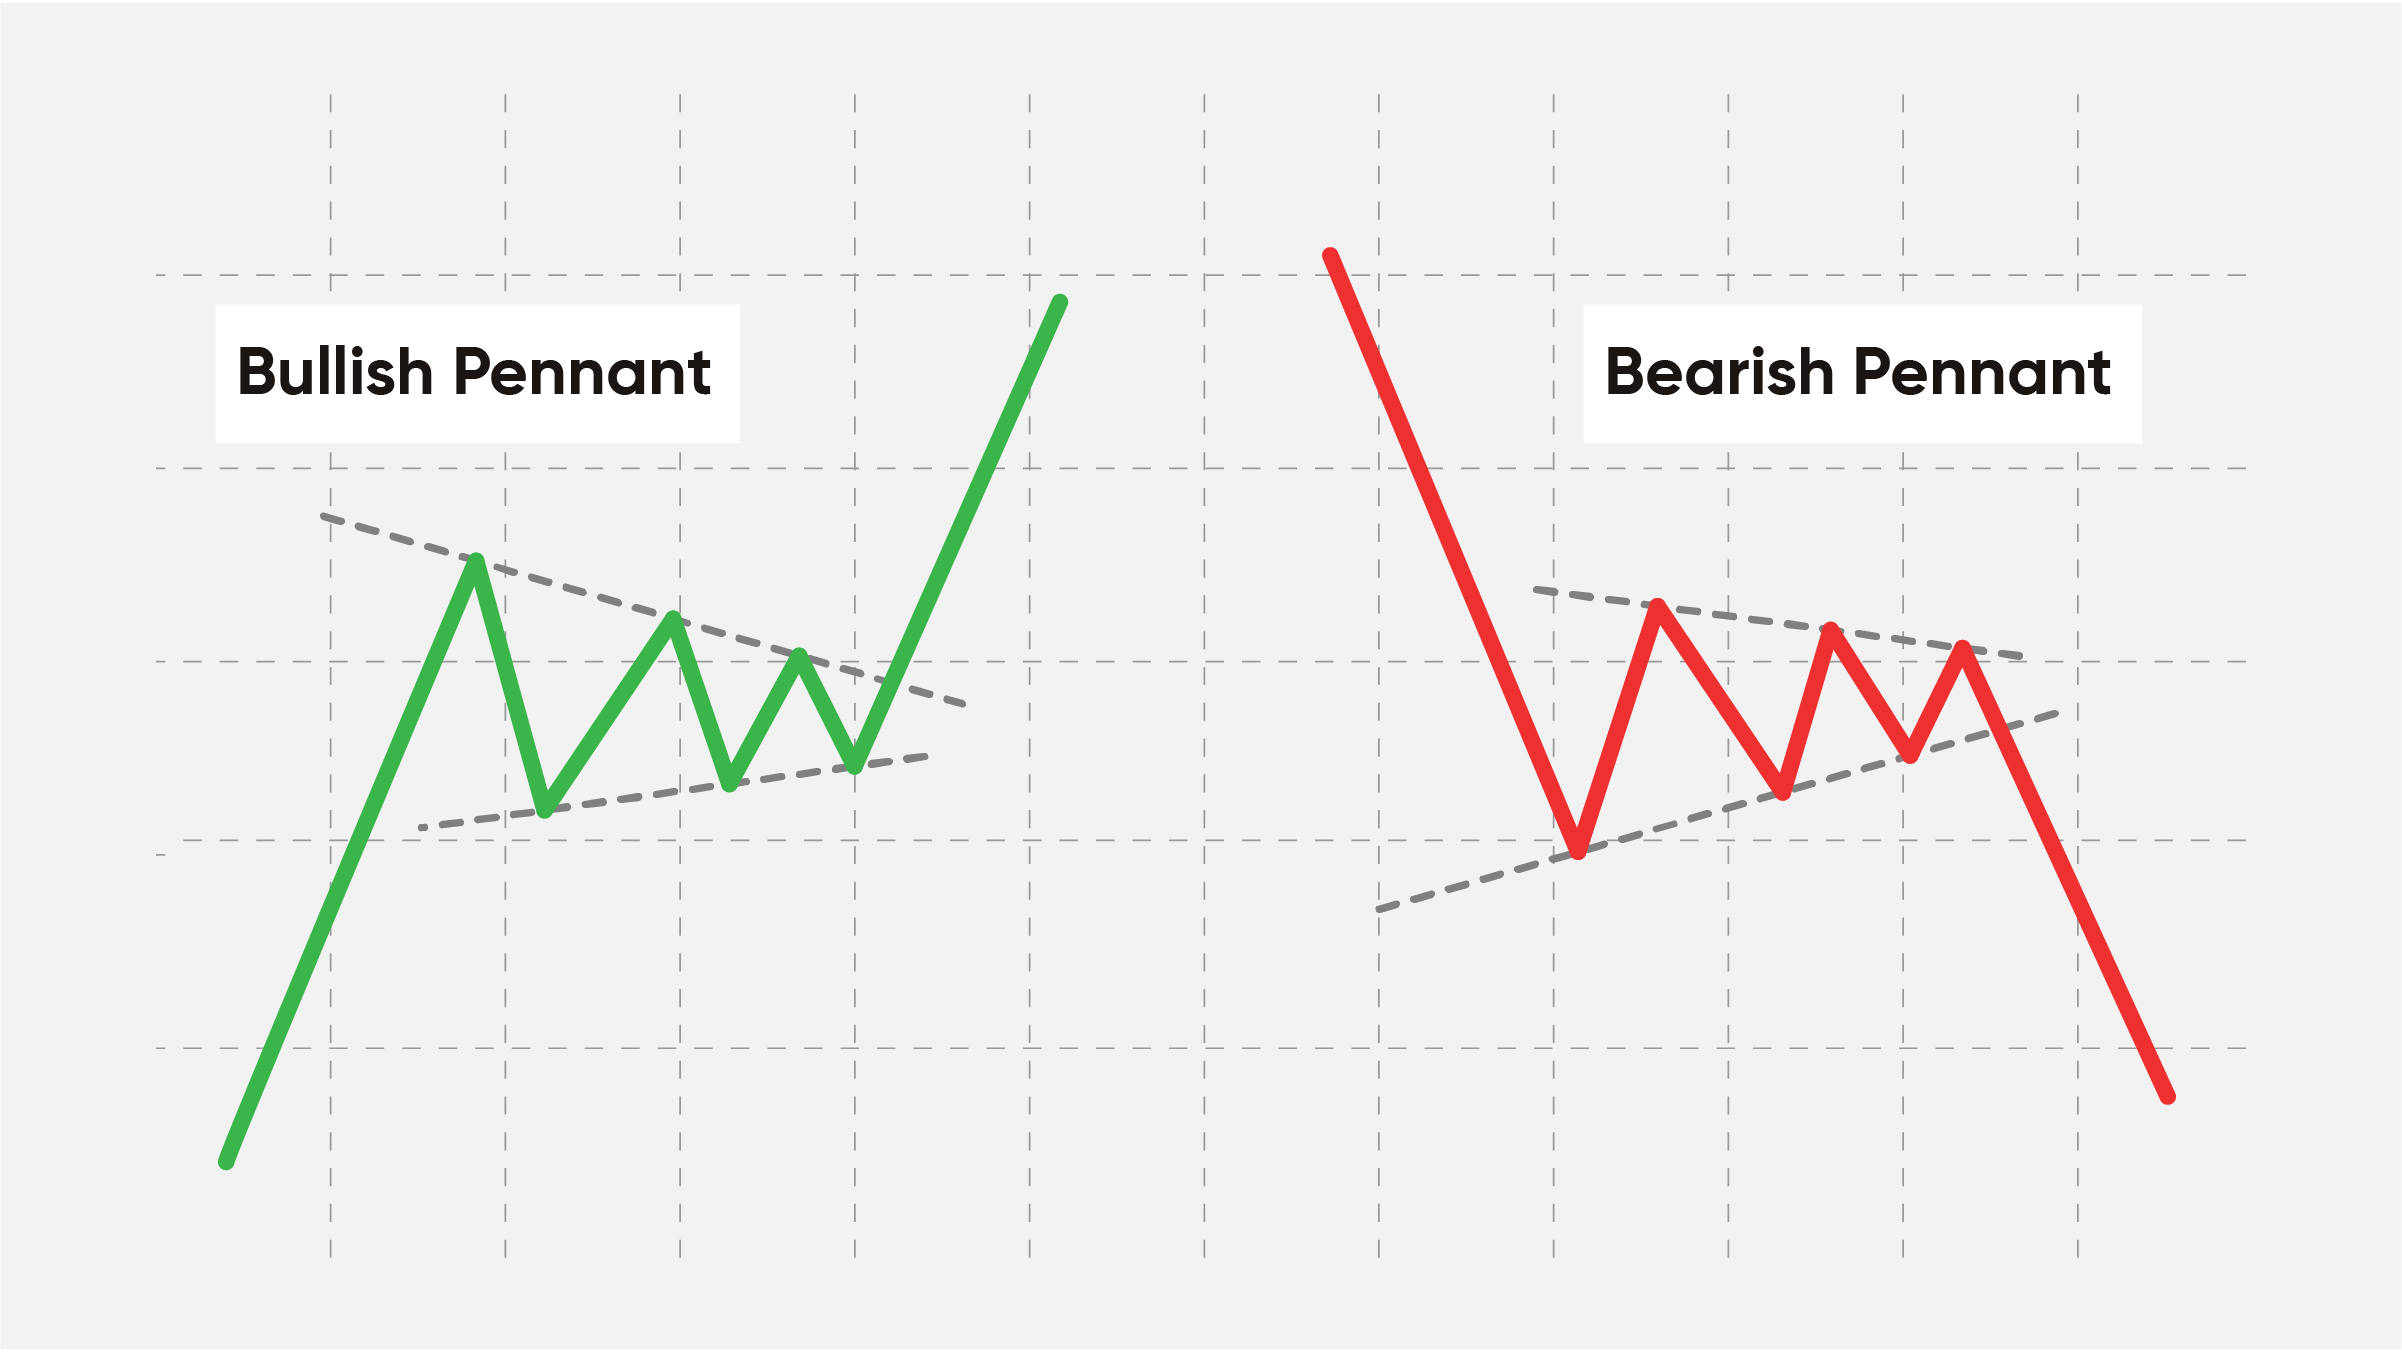
Triangles
In action, it looks like a regular triangle of different heights depending on the type of pattern. Usually, triangles are formed near the end of the dominant trend. Depending on the existing trend direction, the triangle may indicate a strong or weak continuation signal.
Typically, the ascending triangle is formed on an uptrend, continuing the direction of price movement. The same goes for the descending triangle (downtrend situation). But if an ascending triangle appears during a bear trend (or vice versa - a downward triangle appears on a bull trend), then the strength of the trend is low. An analysis of additional information is needed to identify the continuation of the trend.
The symmetrical triangle is neither a bullish nor a bearish pattern since its analysis depends on the main trend. It is considered as a neutral pattern representing the period of consolidation.
The main features of the triangles are as follows:
- Five waves. If there are more waves, then the price movement after the breakthrough is likely to be more significant.
- A price breakout from the first or second sector of the triangle indicates a significant trend strength. Similarly, price breakouts from the last part of the triangle are rather weak, and the changes are short.
- After the breakthrough, the price will cover a distance equal to the widest part of the "body".
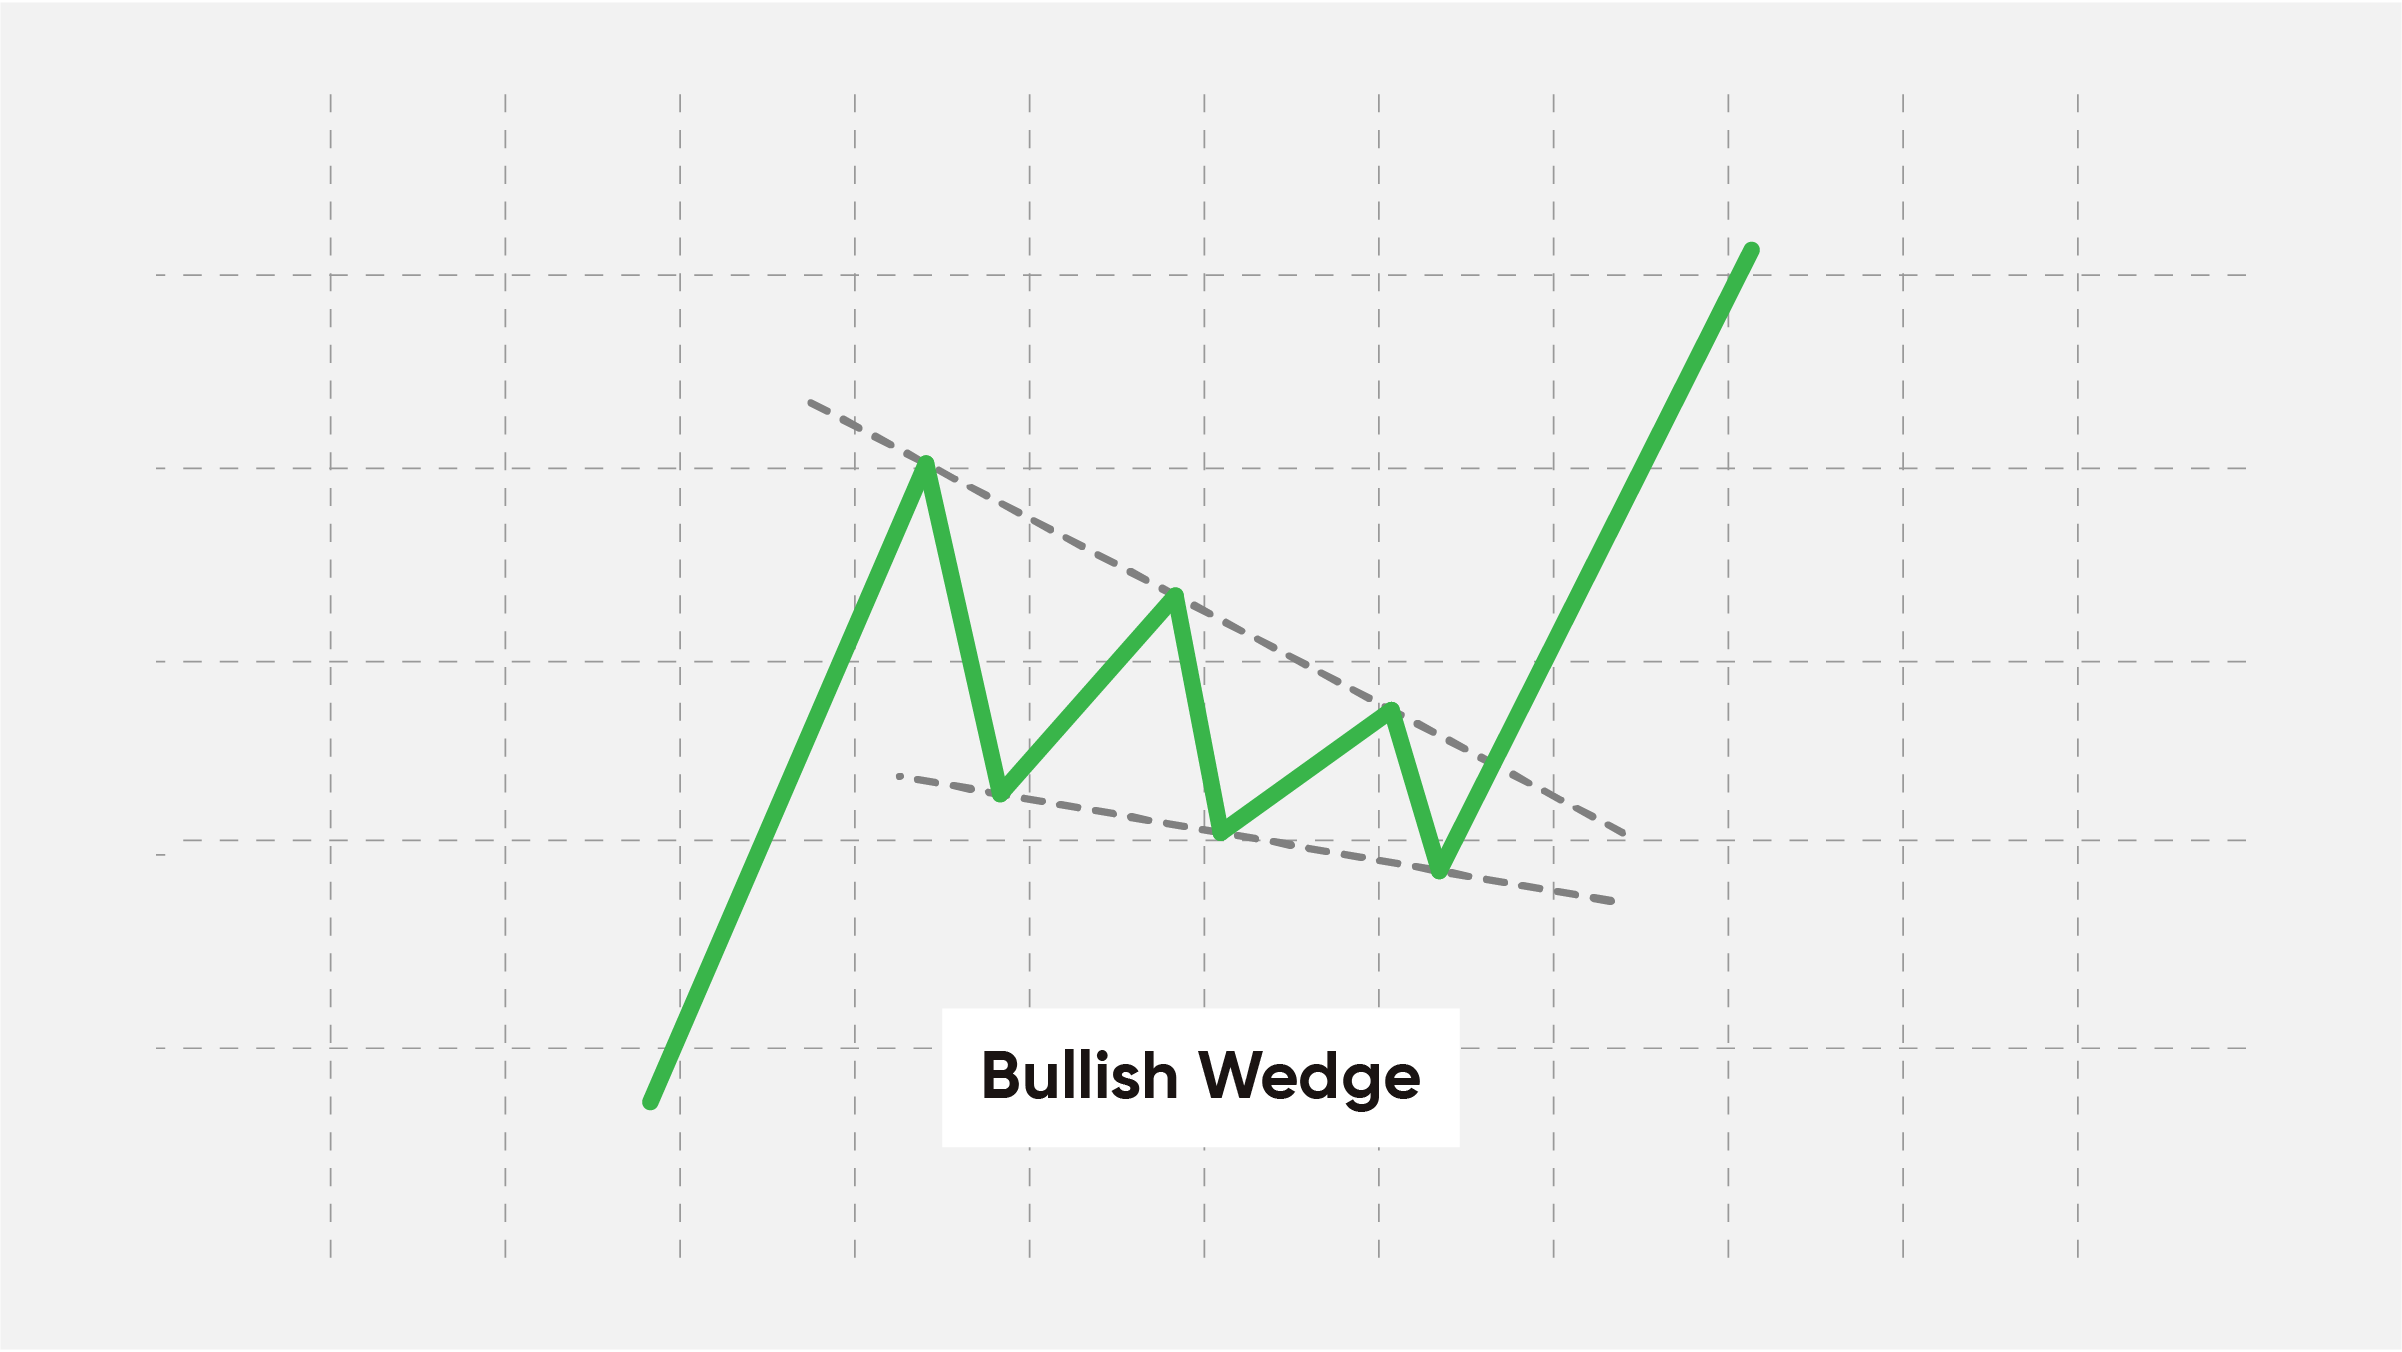
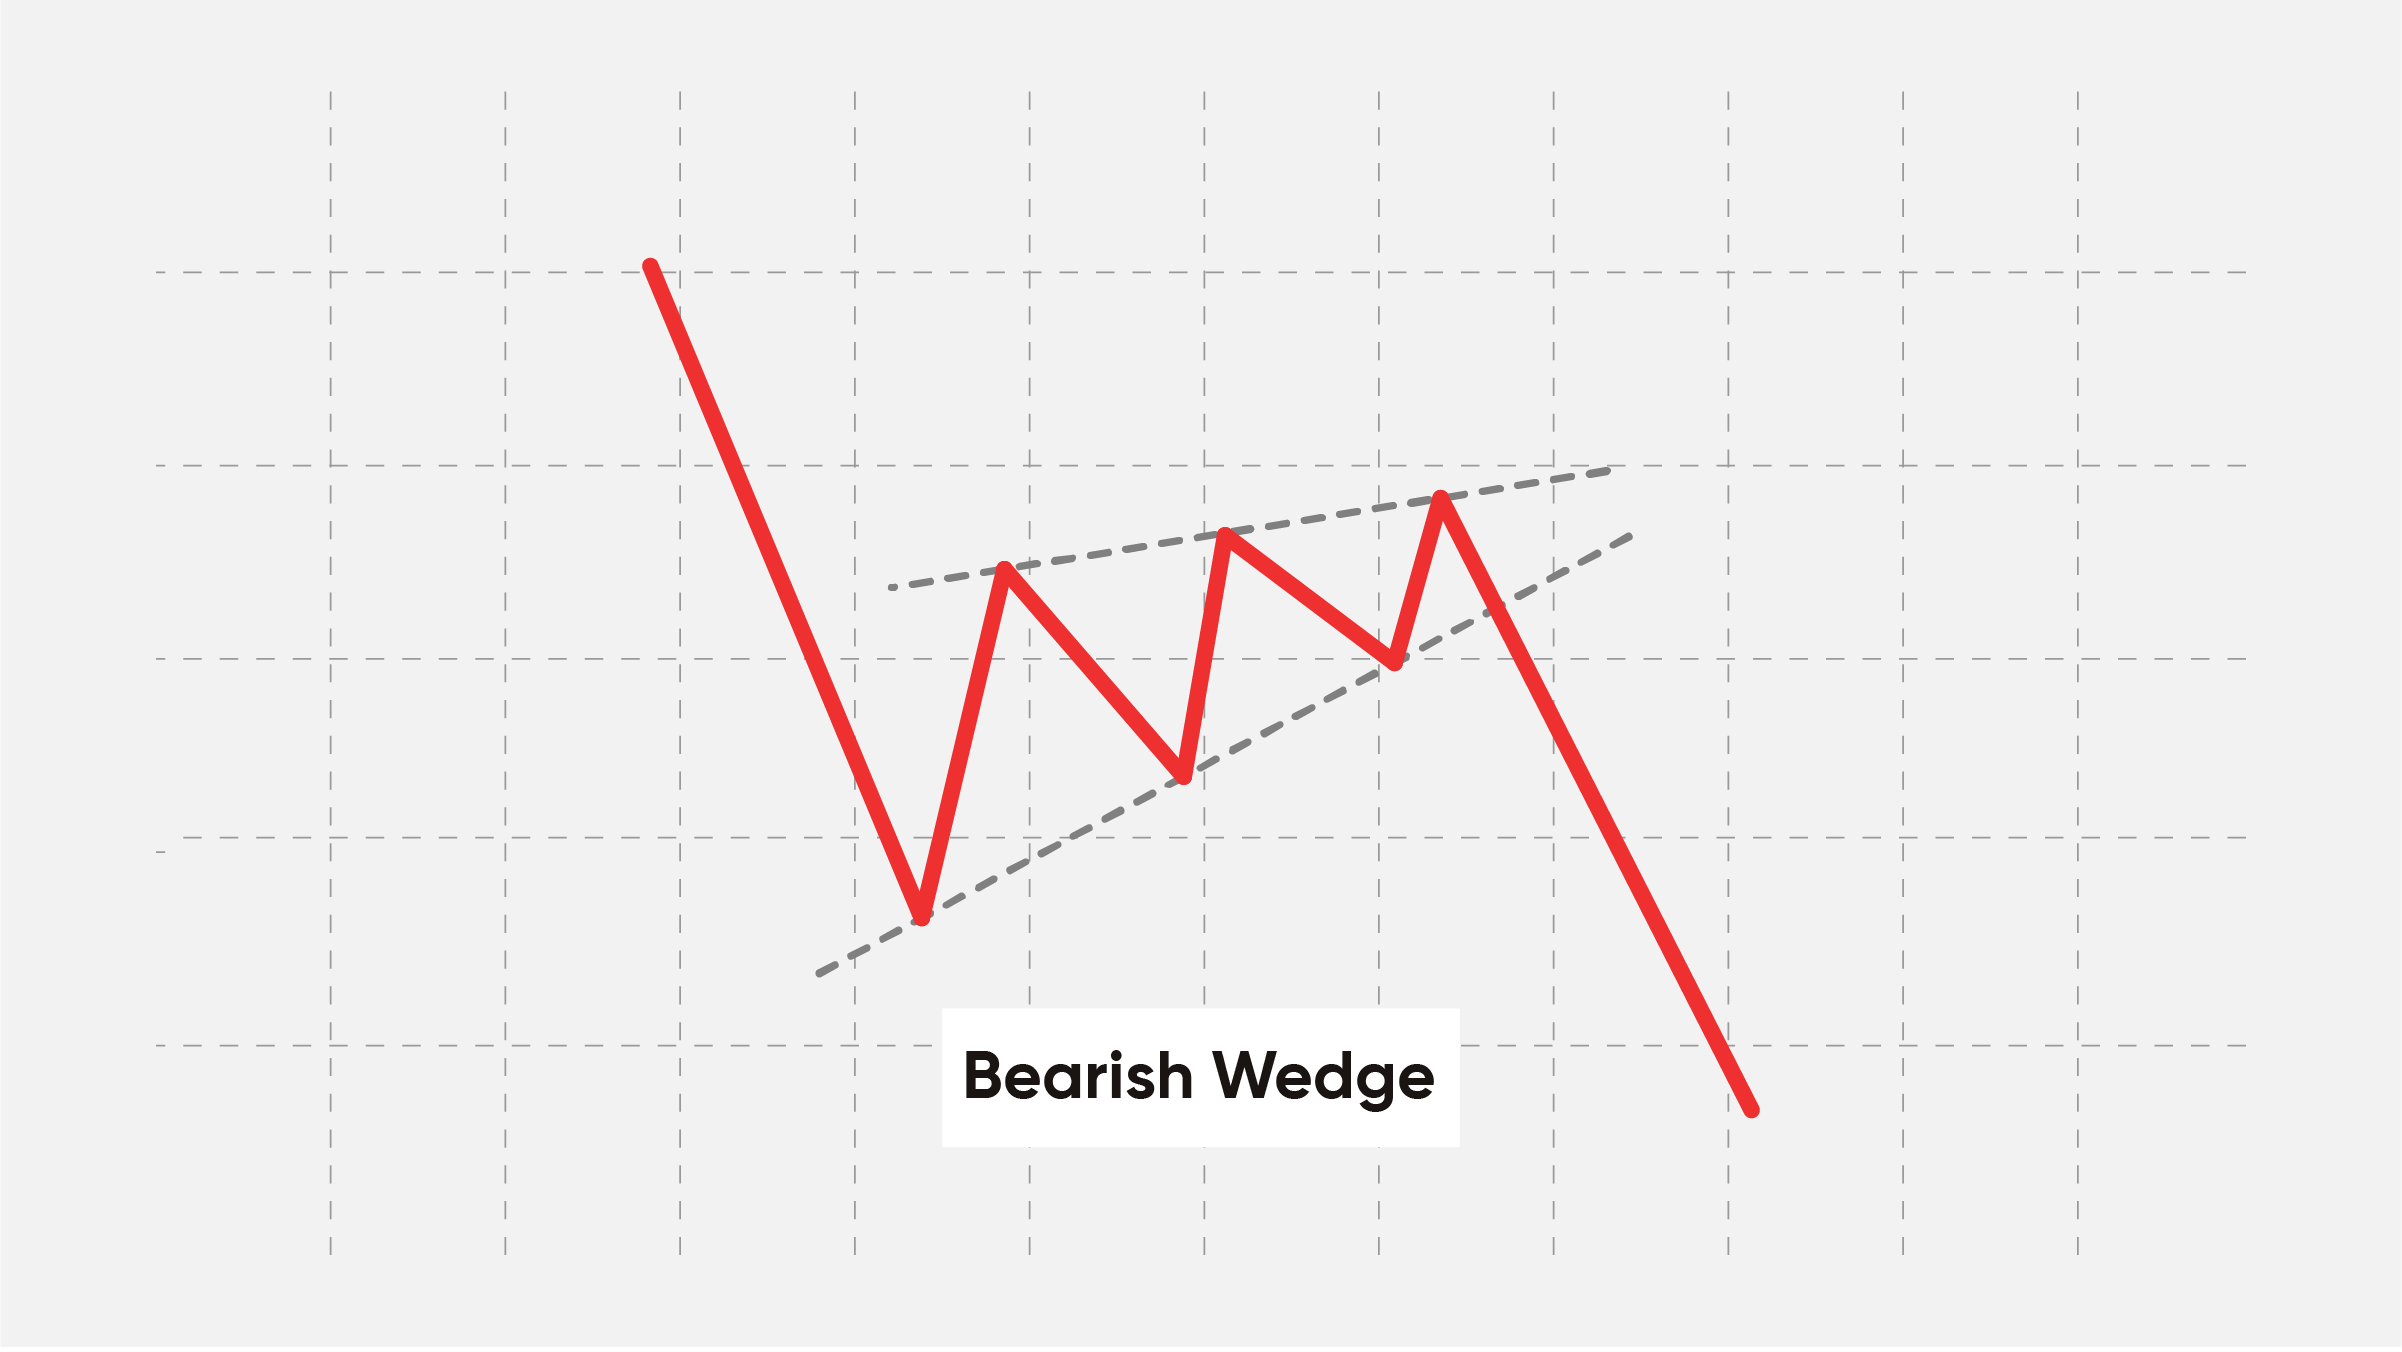
Wedge
Head & Shoulders
The head and shoulders pattern is a quite common pattern after an uptrend, and it represents three peaks, the middle of which (head) is the highest, and the other two peaks on the sides (shoulders). This indicator reverses the price, creating a new downtrend.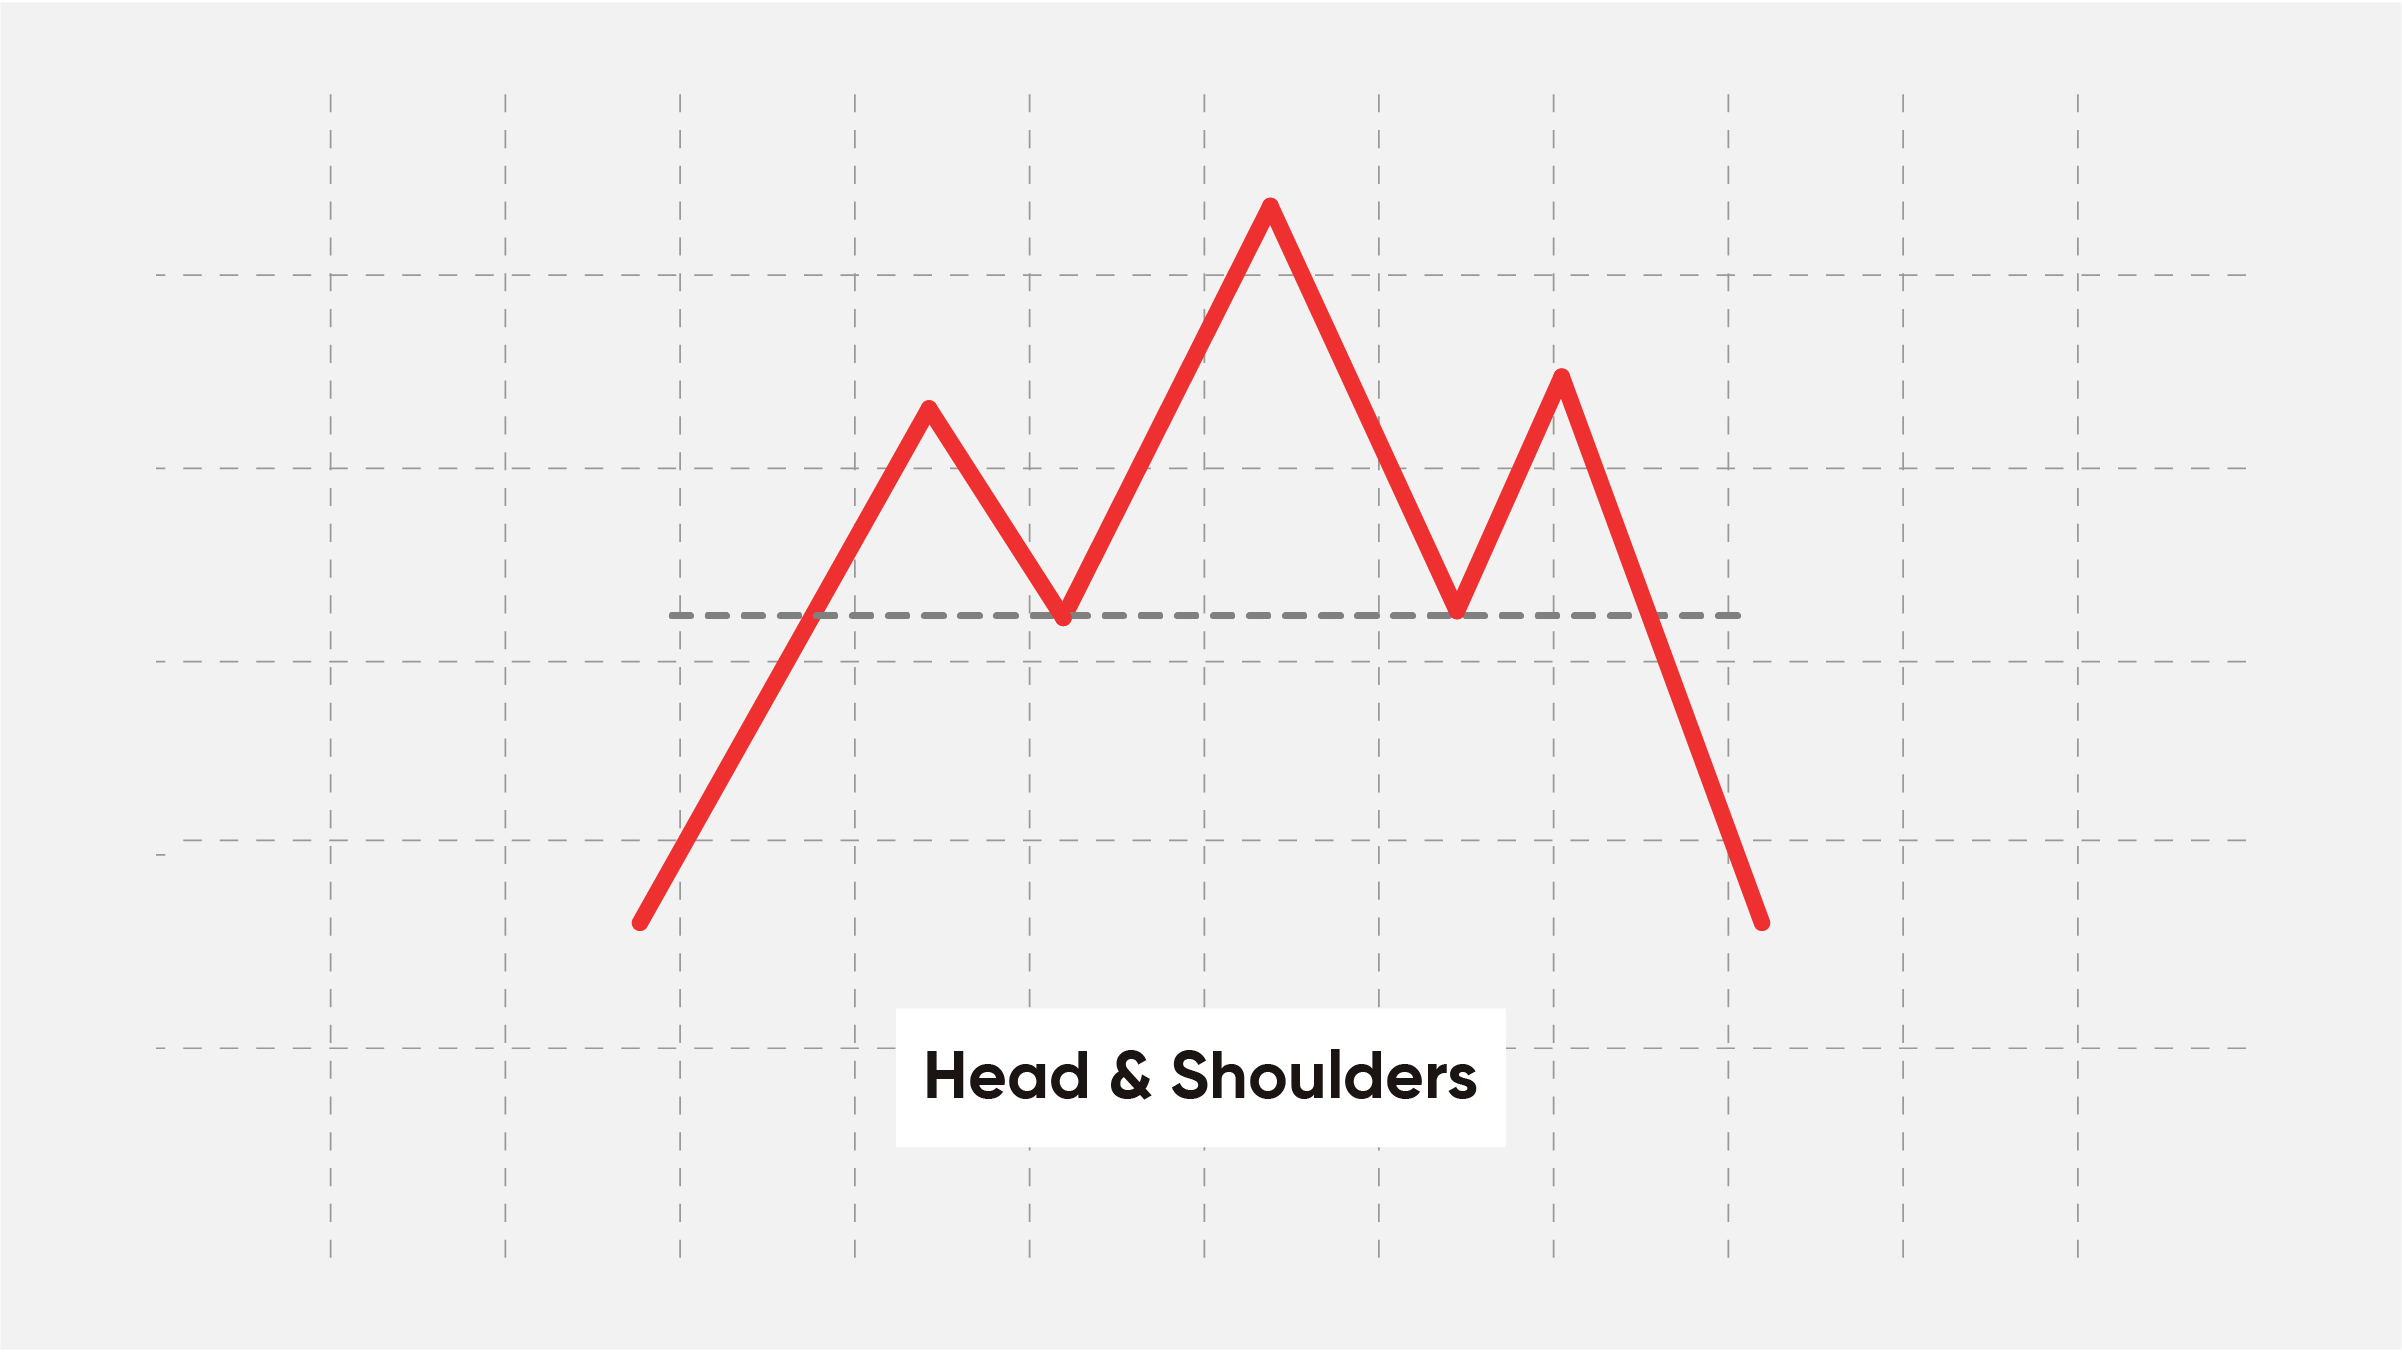
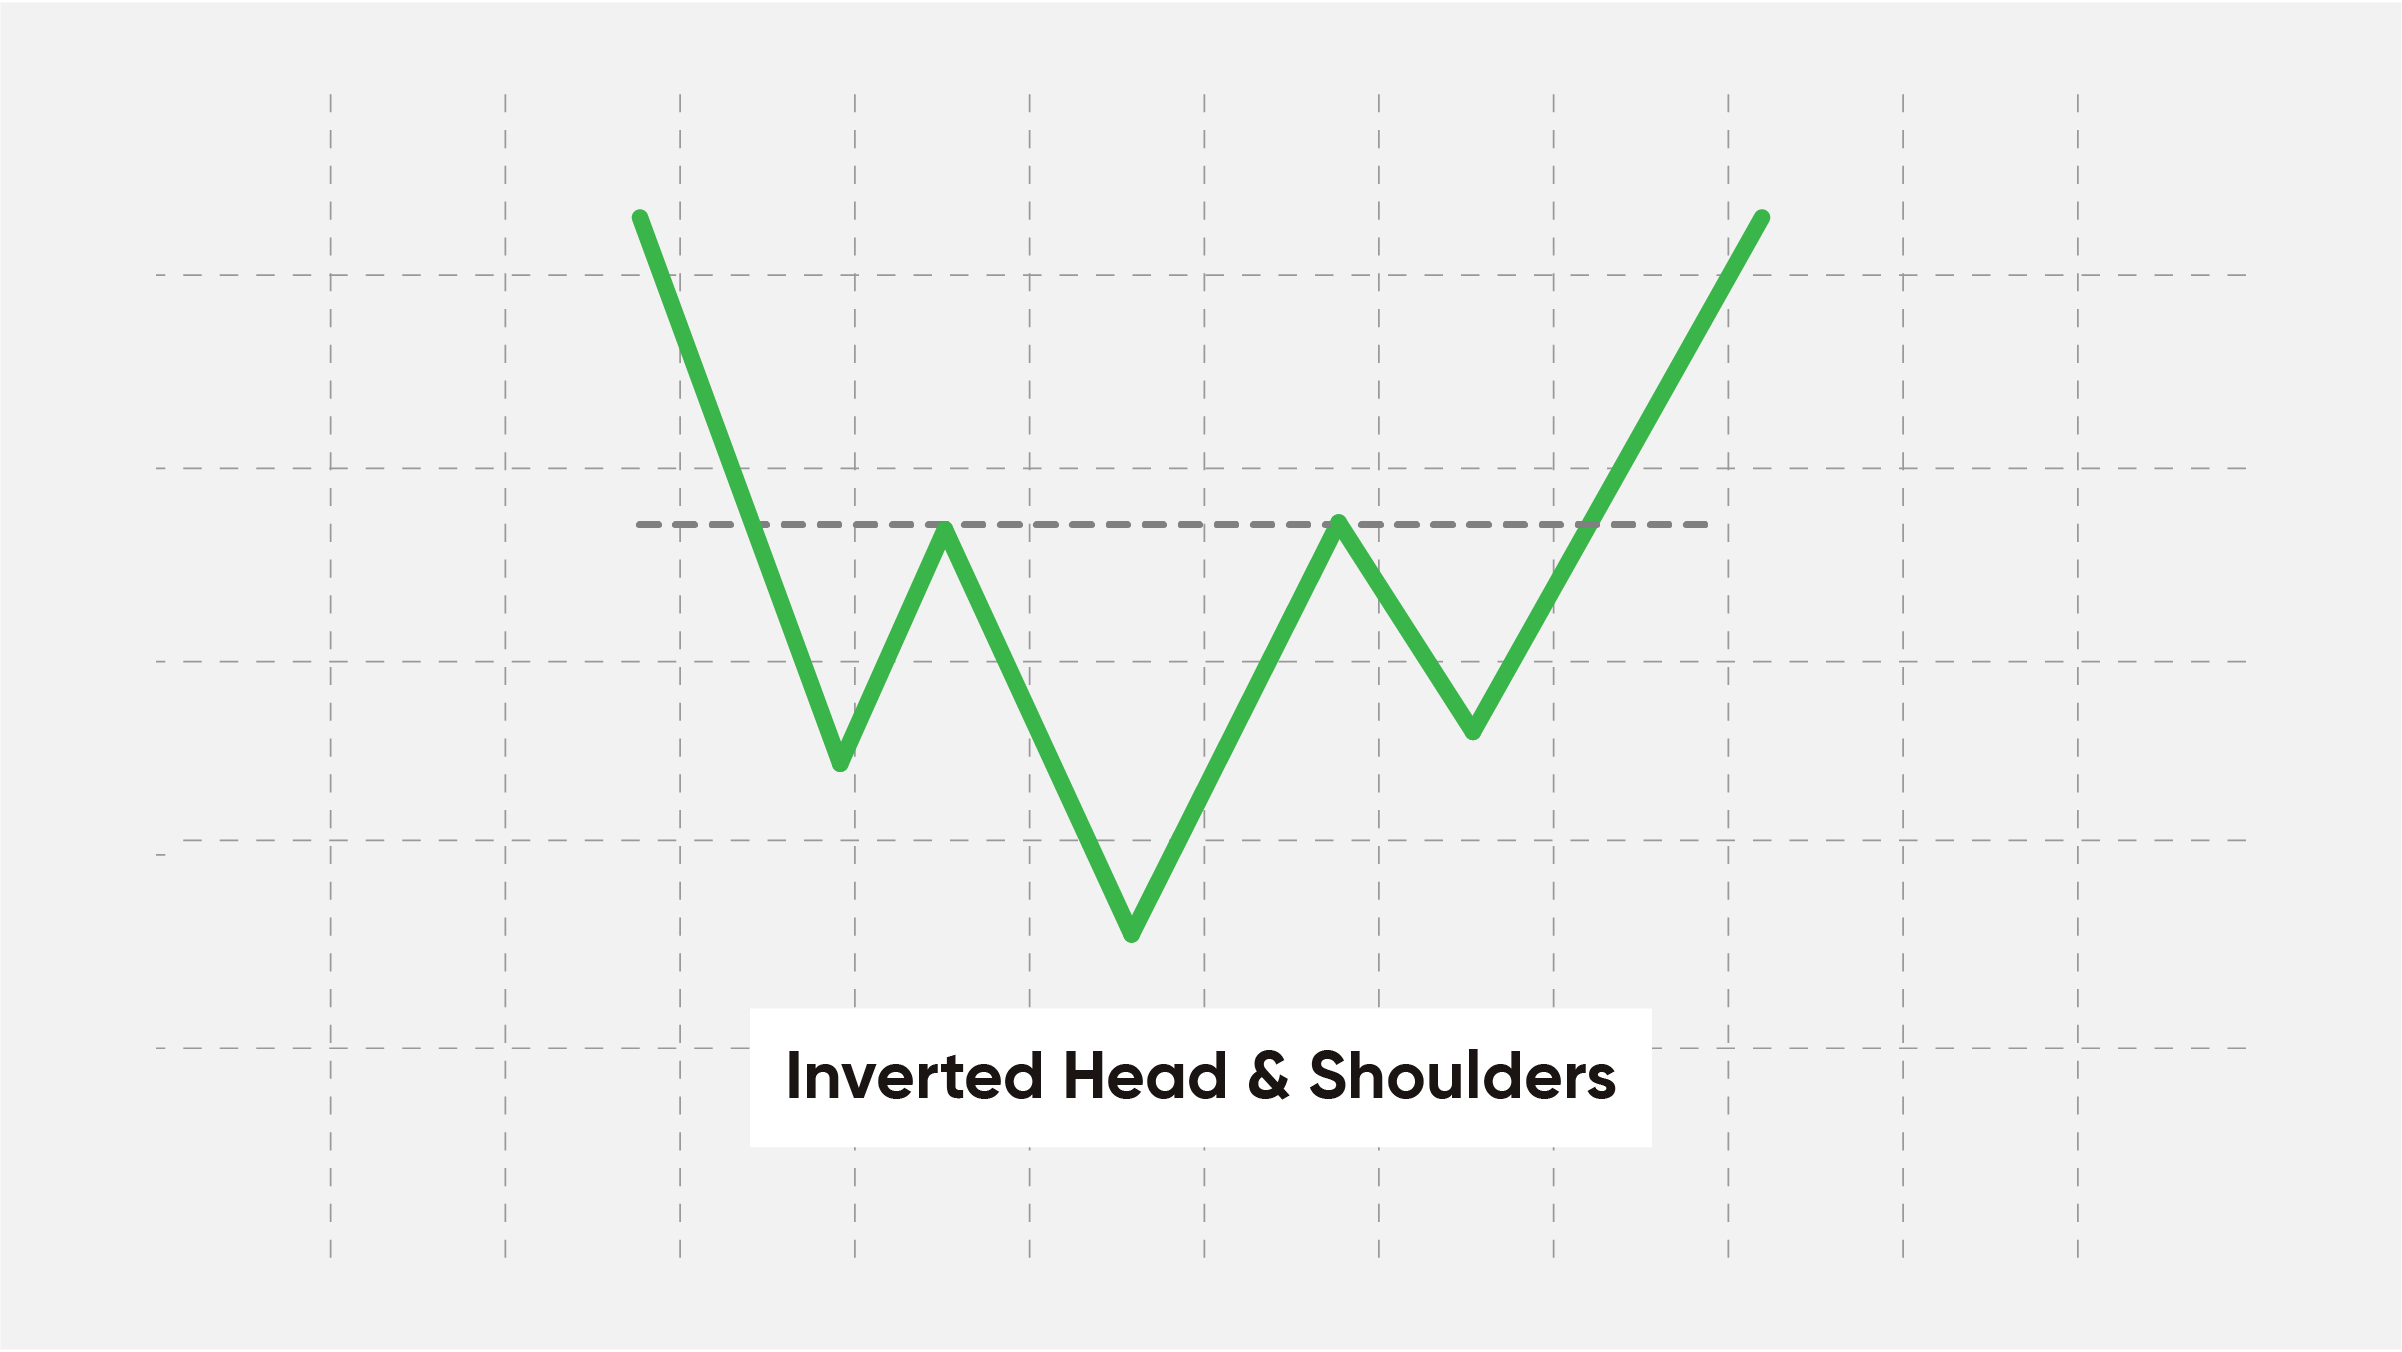
In contrast to this pattern, there is a reverse situation, but already on a downtrend, where this inverted signal gives rise to the appearance of an uptrend.
Closing Remarks
Finding classic patterns in practice takes some time. The longer the charts are analyzed for patterns during TA, the easier it will be to find them. These patterns are great trading signals, as they help predict price targets. The overall usefulness of such patterns to the trader can be significant. In order to properly manage risks, these signals should not be considered in an isolated option.Now you have learned a lot about trading patterns and tools, you can start trading on KickEX to implement the new insights efficiently!