
Today we are going to talk about one of the oldest classic indicators of technical analysis (TA) - the relative strength index RSI. This indicator is included in all trading platforms, it is used in thousands of trading systems in all markets. The index is actively used by both professional and novice traders. This is one of the most popular and effective momentum oscillators, which measures the magnitude of price movement, as well as the speed (rapidity) of these movements. The RSI can be a very useful tool depending on the type of trade being performed.
What is RSI? How to use it correctly and trade by signals? Below you will receive answers to the questions that may arise as you desire to improve your trading with the RSI indicator.
Got enough knowledge and confidence in trading? It’s time to get started with KickEX exchange!
Background
The indicator was developed by J. Welles Wilder and published in Commodities magazine in June 1978. Later, Wilder wrote the book "New Concepts in Trading Systems", where he detailed the essence of the relative strength index. Since the publication of the book, the RSI oscillator has become very popular among traders and has helped many users gauge the strength of the market.Wells Wilder is a stock trader, one of the leading experts in technical analysis, and the developer of many trading systems and indicators. He is the author of such well-known indicators as Average True Range, Relative Strength Index, Directional Movement Indicator, and Parabolic Stop & Reverse.
- “If you can’t cope with emotion — then get out of trading”
- “Some traders are born undisciplined. Life will teach them. It will hurt”
General Overview
The Relative Strength Index (RSI) is an oscillating indicator that shows when the market is in an overbought or oversold situation. The indicator's metrics are formed by comparing price action over a period (typically 14 periods) which allows the indicator to show if the price has become unusually high or low. Thus, it can be used to determine when the current trend ends or when a new one is forming.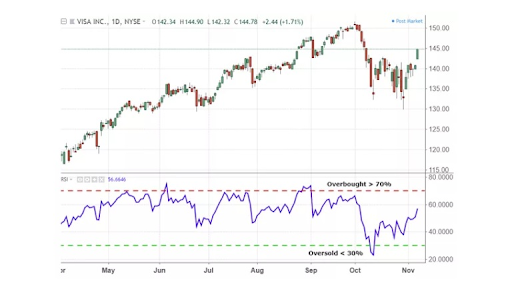
The RSI is useful for traders looking for opportunities to choose the time to enter and exit the market to maximize profits before there is a risk of price decline. The indicator appears below the chart and consists of one line moving between two borders - 0 and 100. It works best when it reaches extreme areas. The evaluation criterion is two lines drawn at the level of 30 and 70. It is believed that above 70 is the overbought zone, and below 30 - the oversold zone. Therefore, when the value of the Relative Strength Index reaches and rises above 70, there is a threat of a decline in prices; movement below 30 is perceived as a warning of an imminent rise. Some analysts advise accepting levels 30 and 70 as boundaries only in case of sideways trends, and 20 and 80 - with pronounced bullish and bearish trends.
RSI Formula
RSI = 100 - 100 / (1 + RS)
RS = Average Gain / Average Loss
How to use it?
The book "New Concepts in Technical Trading Systems" initially offers several options for using this market tool. And below we will consider the most basic and common ones:- The first way is to visually identify the graphical figures that appear on the scale - triangles, pennants, flags, rectangles, and so on. They signal the continuation or reversal of the trend. Many pros are skeptical about this technique, but it has its followers.
- The next is to analyze the peaks and troughs that form above 70 and below 30, respectively.
- Using the RSI to identify support and resistance levels. In the classic version, these are overbought and oversold lines at 70 and 30. But you can also draw trend lines by connecting peaks and troughs using graphical tools.
- Often, traders supplement their trading strategy with signals when the indicator line crosses the middle 50 levels.
The main signal of the RSI oscillator is the determination of overbought and oversold points. And although it is most often used as a filter in systems where the trend is the main indicator, theoretically one can try to trade only on the signals of the Relative Strength Index.
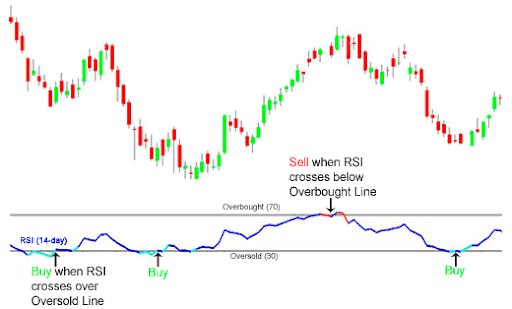
When the indicator line rises above level 70 or below level 30, it is a signal that the market is overbought/oversold, and one needs to wait for the next signal that shows a reversal.
RSI trades are opened according to the following principle:
- If the indicator line crosses level 70 from top to bottom, a sell deal is opened.
- If the curve crosses level 30 from the bottom up, a buy trade is opened.
There are several options for closing a deal:
- Set stop loss to the local extremum, and take profit - 2-3 times larger.
- Exit on the opposite signal of the indicator.
- Set stop loss and take profit at the next key levels, or by Fibonacci (in this case, the take profit should be no less than the stop loss, otherwise, it is better to refrain from opening a deal).
Closing line
The RSI oscillator is an effective and proven tactic for determining the strength of a trend and its reversals for decades. Even though the markets have been characterized by increased volatility lately, its relevance does not subside. Novice traders should use it on a horizontal flat when there is no pronounced trend in the market.The indicator shows itself perfectly when paired with others, such as MACD, MA, Bollinger Bands, Parabolic, and other strong trend instruments. It does an excellent job of filtering out false signals from other indicators. Even though this is the main tool for advanced traders, it is also easy to understand for beginners due to its simplicity and clarity.