It is not a problem for traders to find logical levels of market entry. To do this, it is enough to have a certain concentration on this particular aspect of trading. However, when and where to exit a position is often a more difficult question for many.
Many want to give their position a little leeway at the start of a potential trend, but when the trend movement seems to stall or start to fizzle out, it would be nice to get an effective signal for a quick exit to keep the maximum profit. Using moving average crossovers or trend line analysis can cause you to exit too early when a move is making rapid reversals, or too late at the end of a new move.
A good solution here is the parabolic time/price system, which got its name from the shape of the model, which resembles a parabola or “French Curve”.
The indicator was developed and described in 1976 by Welles Wilder. Initially, the name of this indicator was SAR, as a combination of capital letters "stop and reversal". Due to the complexity of the calculation, the indicator has found active use in the era of dominance in the technical analysis of computer technology. This indicator is usually called the "Parabolic System". It is named so because the signals for closing, given in the course of price changes, draw a kind of parabola.
Wilder was looking for a system that could capture most of the trending market gains without relying on any external profit-holding methods. Parabolic calculations result in a series of trailing stops that, if triggered, signal a trend reversal. Stops are recalculated daily (or for each time frame used by the trader) and get closer as the trend progresses. If the trend cannot continue, the indicator readings change the position to the opposite one and a new period will begin.
The essence
The parabolic indicator is referred to as trend indicators and sets moving price stops for long or short positions. It represents a line, very similar to a parabola, which is superimposed on the price chart. Based on the relative position, appropriate conclusions are drawn about the state of the market and the prospects for its development. If the price crosses the Parabolic SAR lines, then the indicator reverses, and its next values are located on the other side of the price. The reference point will be the maximum or minimum price for the previous period.
How to Use the Indicator?
When using the Parabolic SAR Indicator, one should take into account both its location relative to the price chart and the acceleration factor that grows with the development of the trend. Despite its popularity as a graphical analysis tool, the indicator has a number of limitations and can give false signals in the event of frequently changing market dynamics.
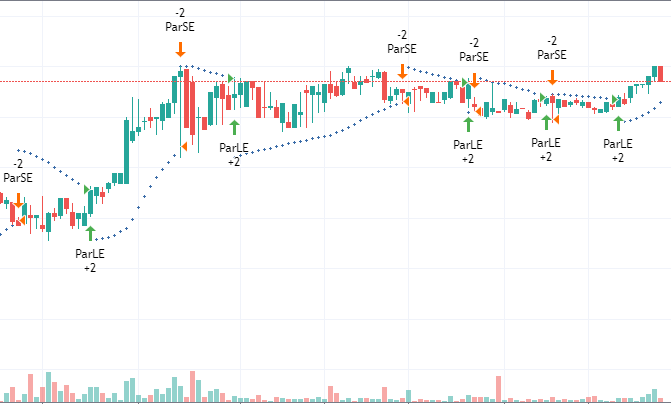
Parabolic SAR indicator gives the following signals: 1. Trend confirmation
Located below the price chart, the indicator confirms the presence of an uptrend;
Located above the price chart, the indicator confirms the presence of a downtrend;
2. Identification of the closing positions
When the price falls below the indicator in an uptrend, one should close long positions;
When the price rises above the indicator in a downtrend, one should close short positions;
Signal significance is determined using an acceleration factor. The acceleration factor increases every time the current closing price is higher than the previous one in the case of a bullish trend and lower than the previous one in the case of a bearish trend. It is believed that the Parabolic indicator is more reliable when the price and the indicator curve move in parallel, and less reliable when they begin to converge.
The formula for the Parabolic SAR is as follows:
Uptrend Parabolic SAR = Prior SAR + Prior AF (Prior EP – Prior SAR)
Downtrend Parabolic SAR = Prior SAR – Prior AF (Prior SAR – Prior EP)
Where:
EP is the extreme point in a trend (highest point reached by a price during an uptrend or the lowest price reached during a downtrend).
AF is the acceleration factor which is initially set to a value of 0.02 (it is increased by 0.02 each time the EP is recorded, with a maximum of 0.20). Traders can choose the acceleration factor depending on the trading style or instrument being traded).
Closing Line
Developed by Wales Wilder, the Parabolic SAR indicator is a valuable trading tool in today's markets. This system is difficult to calculate but quite affordable for the average trader to use. Unlike most methods of analysis, a parabolic is always unambiguous - it simply does not have an uncertain position. After the position has been entered, the parabolic clearly defines where the pivot point is and a possible exit from it.