Intro
As we have already figured out, in all financial markets the price of any asset is shown in the form of graphs that are constantly changing during the trading session. Candlestick analysis of the currency market remains popular to this day, proving its effectiveness and relevance. Its patterns are a combination of market bars from 1 to 5 that predict further movement in the market. Using candlestick analysis in trading is quite easy, first of all, one should understand the pattern itself and what is followed by it (continuation of the trend or its reversal).Basic Definition
Candlestick analysis is a method of forecasting the charts of financial instruments, which is based on the application of the combinations formed on the charts in the form of Japanese candlesticks. Analysis of candlestick combinations is used in algorithmic trading and is applicable in any markets, whether it is the cryptocurrency market, forex, stock, or futures. This is a great tool for both beginners and advanced traders, used for day trading, swing trading, and even long-term trading. Some candlestick patterns may provide a perception of the balance between buyers and sellers; others may indicate a reversal, continuation, or indecision.Candlestick Patterns
There are many different patterns, but we will discuss some of the most popular ones that will help you learn to read charts as a professional trader. Reading candlesticks can give us information on three market sentiment: bullish, bearish, or neutral.Below are some patterns that can help us gauge market sentiment.
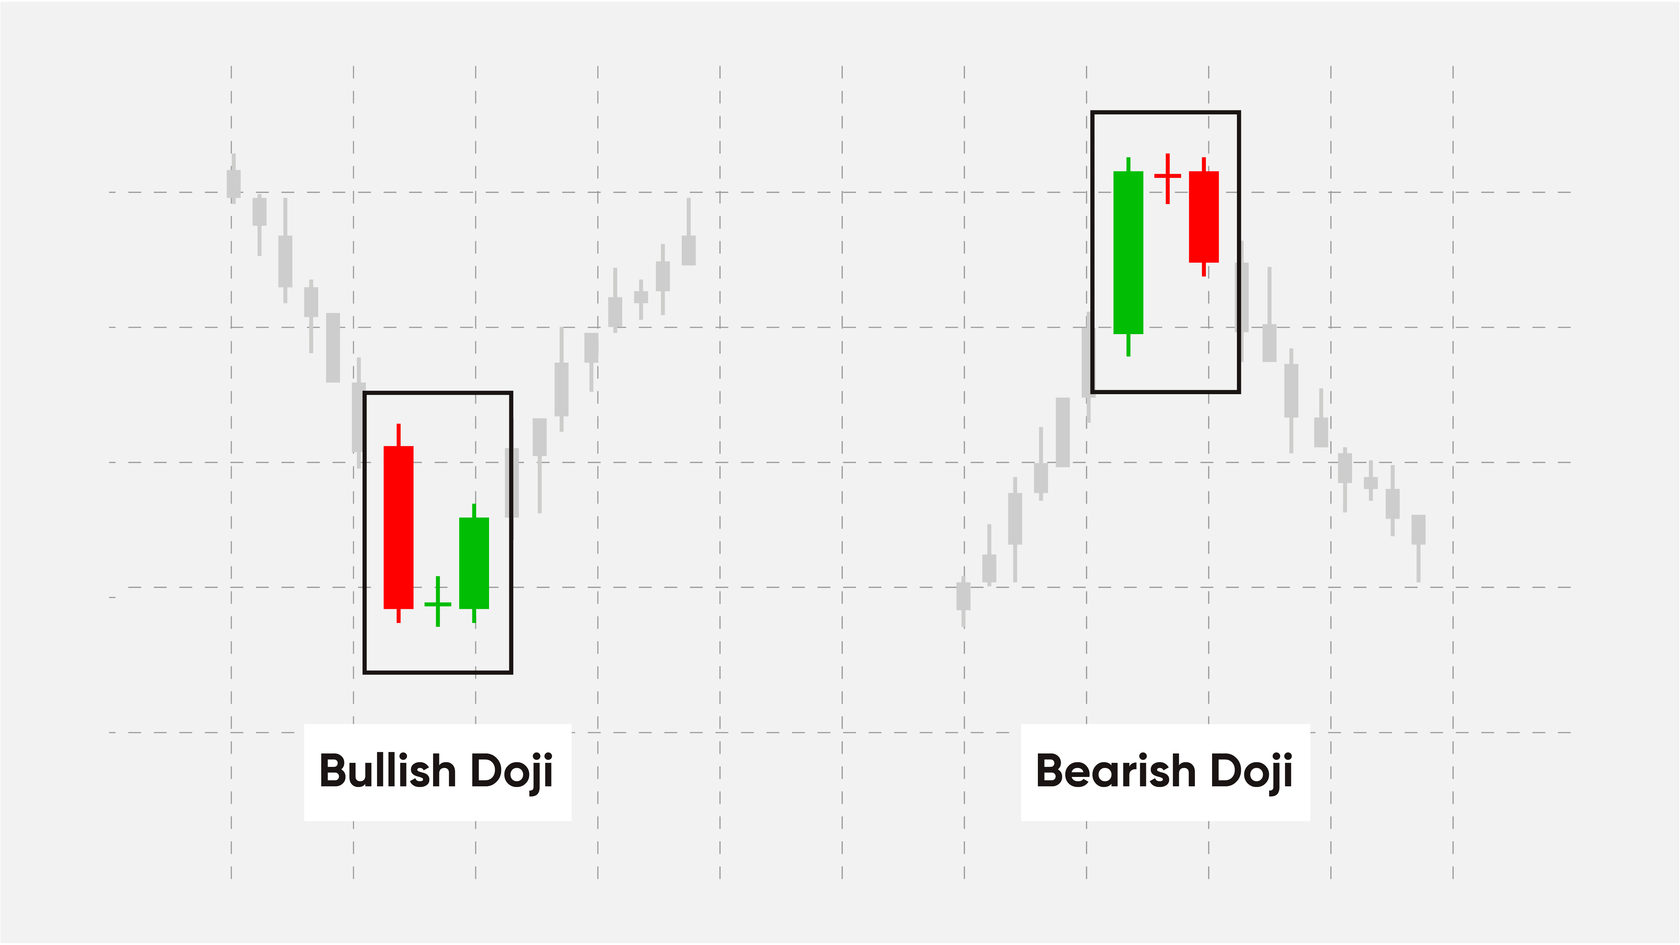
It's pretty straightforward: a bullish candle indicates a continuation of a bullish trend, and a bearish candle indicates a continuation of a bearish trend. The doji candle, on the other hand, is a neutral market condition.
Doji indicates indecision and a possible reversal if it appears in a trend. For example, if a doji forms in a bullish trend, this tells us that the strength of the bulls is depleted, and the bears begin to resist more and more. Doji itself is not a signal and should not be traded separately. It is important to remember that this is a candle of uncertainty. After a long and strong rally, the doji shows that the market has stopped and that the situation is being reassessed.
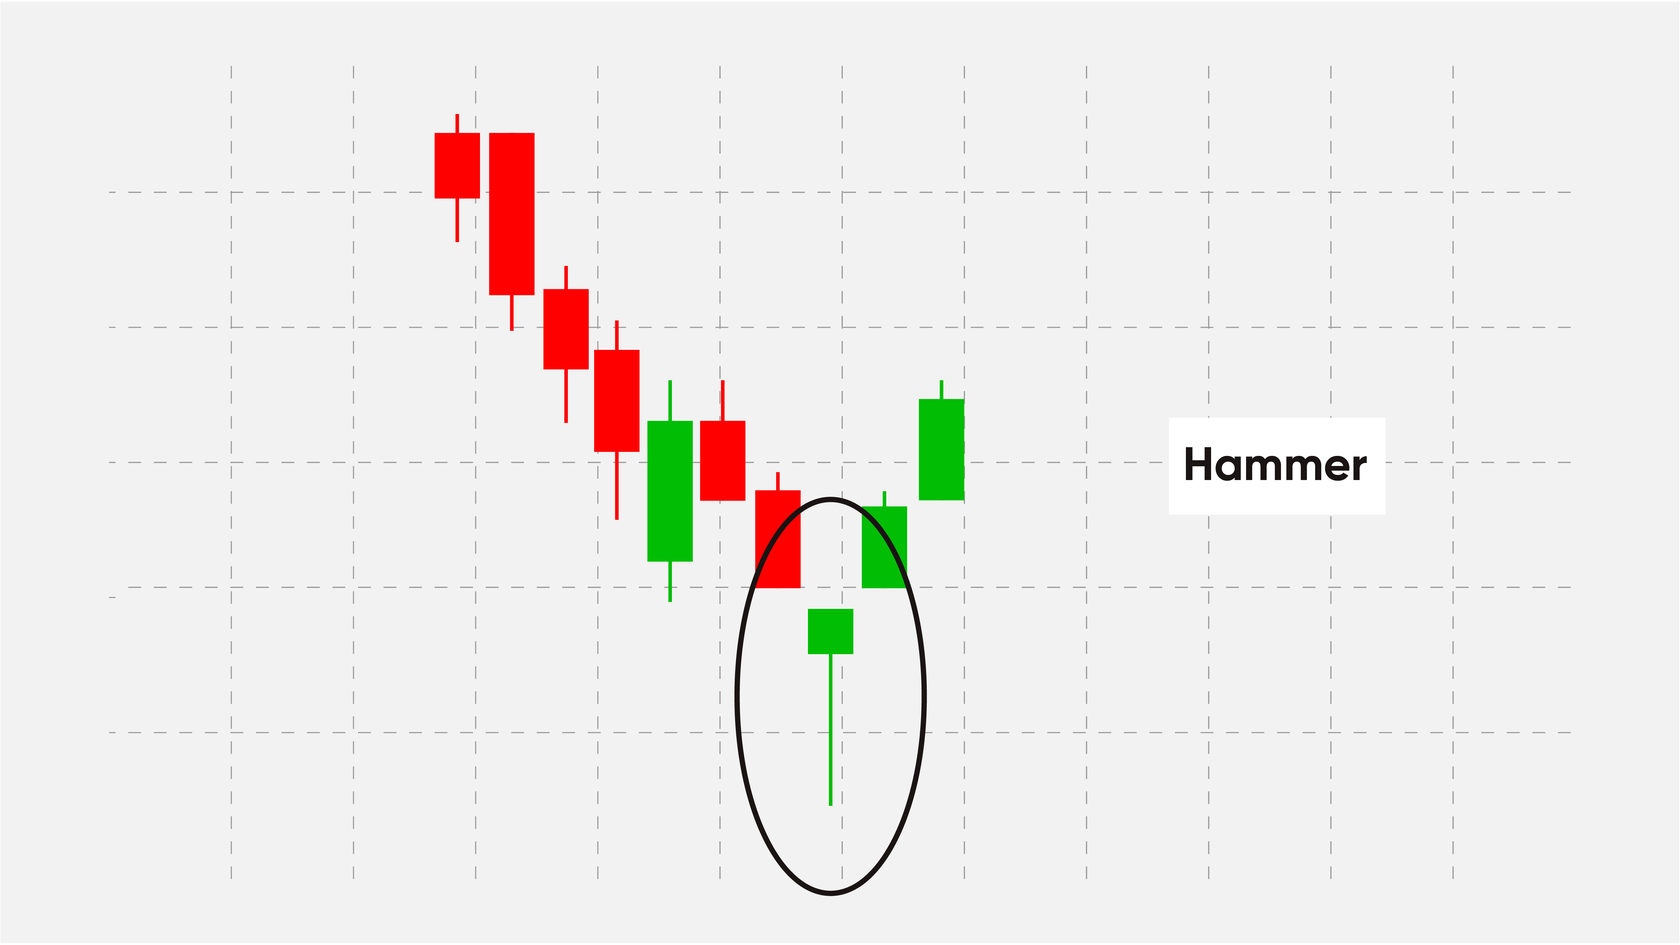
A hammer is a bullish reversal pattern that forms during a downtrend. It is called like that because the market reaches its bottom and hits it like a hammer. A long lower shadow indicates that sellers were pushing the price down, but buyers were able to overcome the pressure on the sale, and the price closed near the opening.
The appearance of a hammer in a downtrend does not mean that one needs to open a buy position. A more reliable factor indicating a trend reversal will be the appearance of a bullish candle after the hammer.
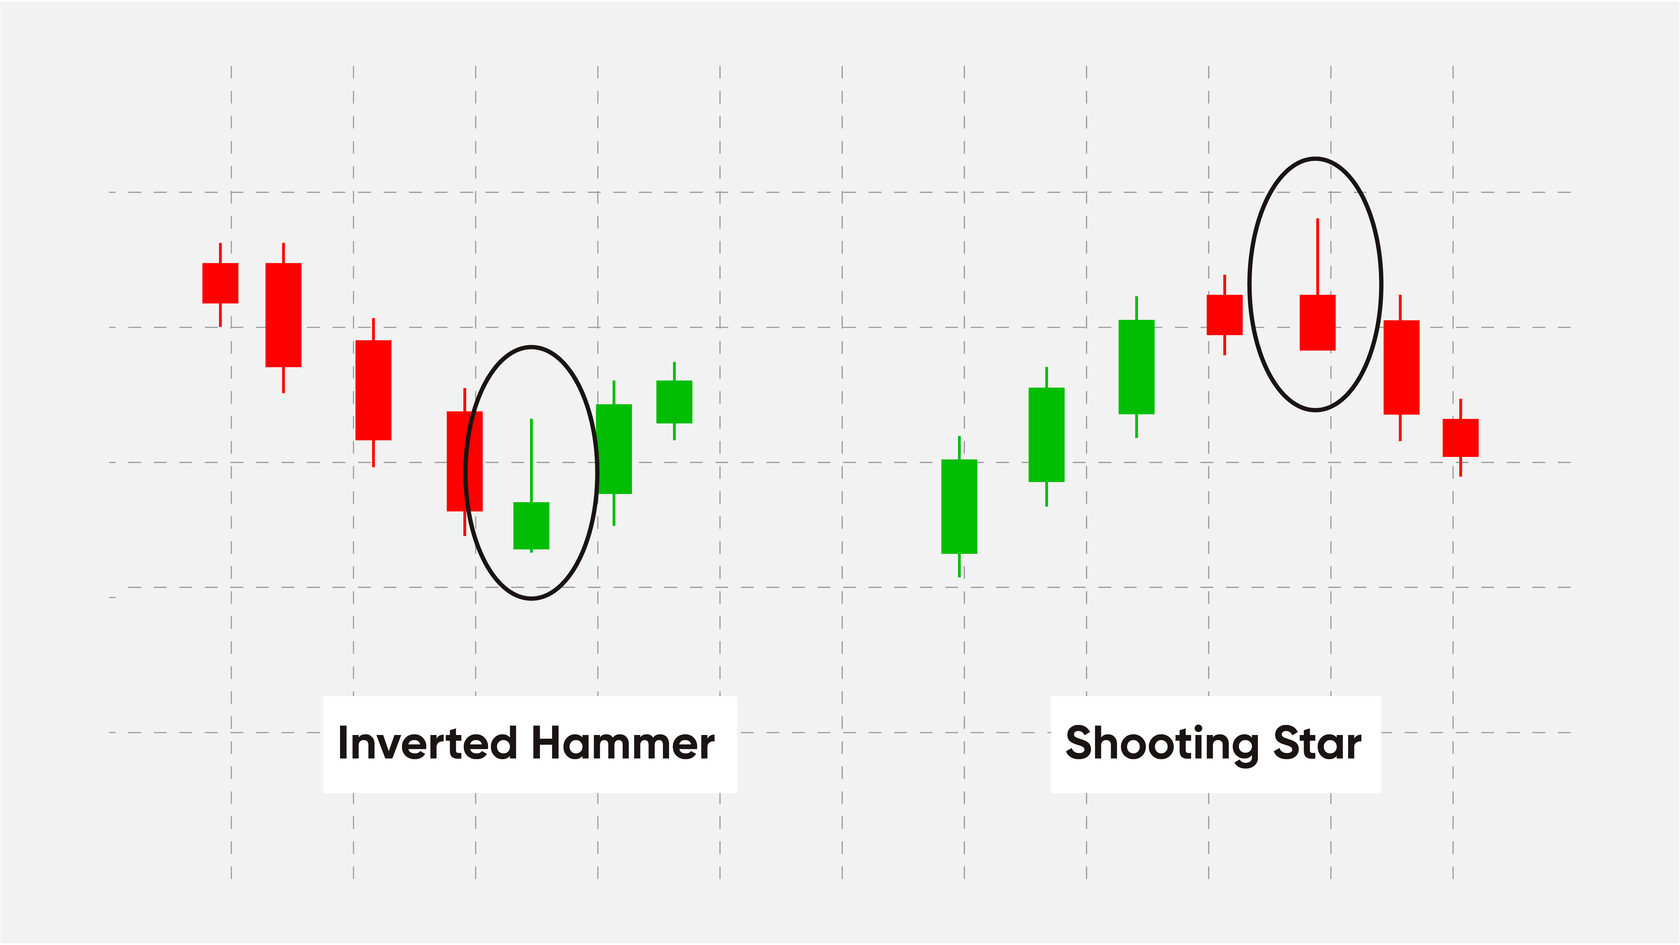
The inverted hammer and the shooting star look the same. The only difference between them is whether they appear in a downtrend or an uptrend.
- Inverted hammer - signals a bullish reversal.
- Shooting star - signals a bearish reversal.
Both patterns have small bodies, long upper shadows, and small or completely missing lower shadows.
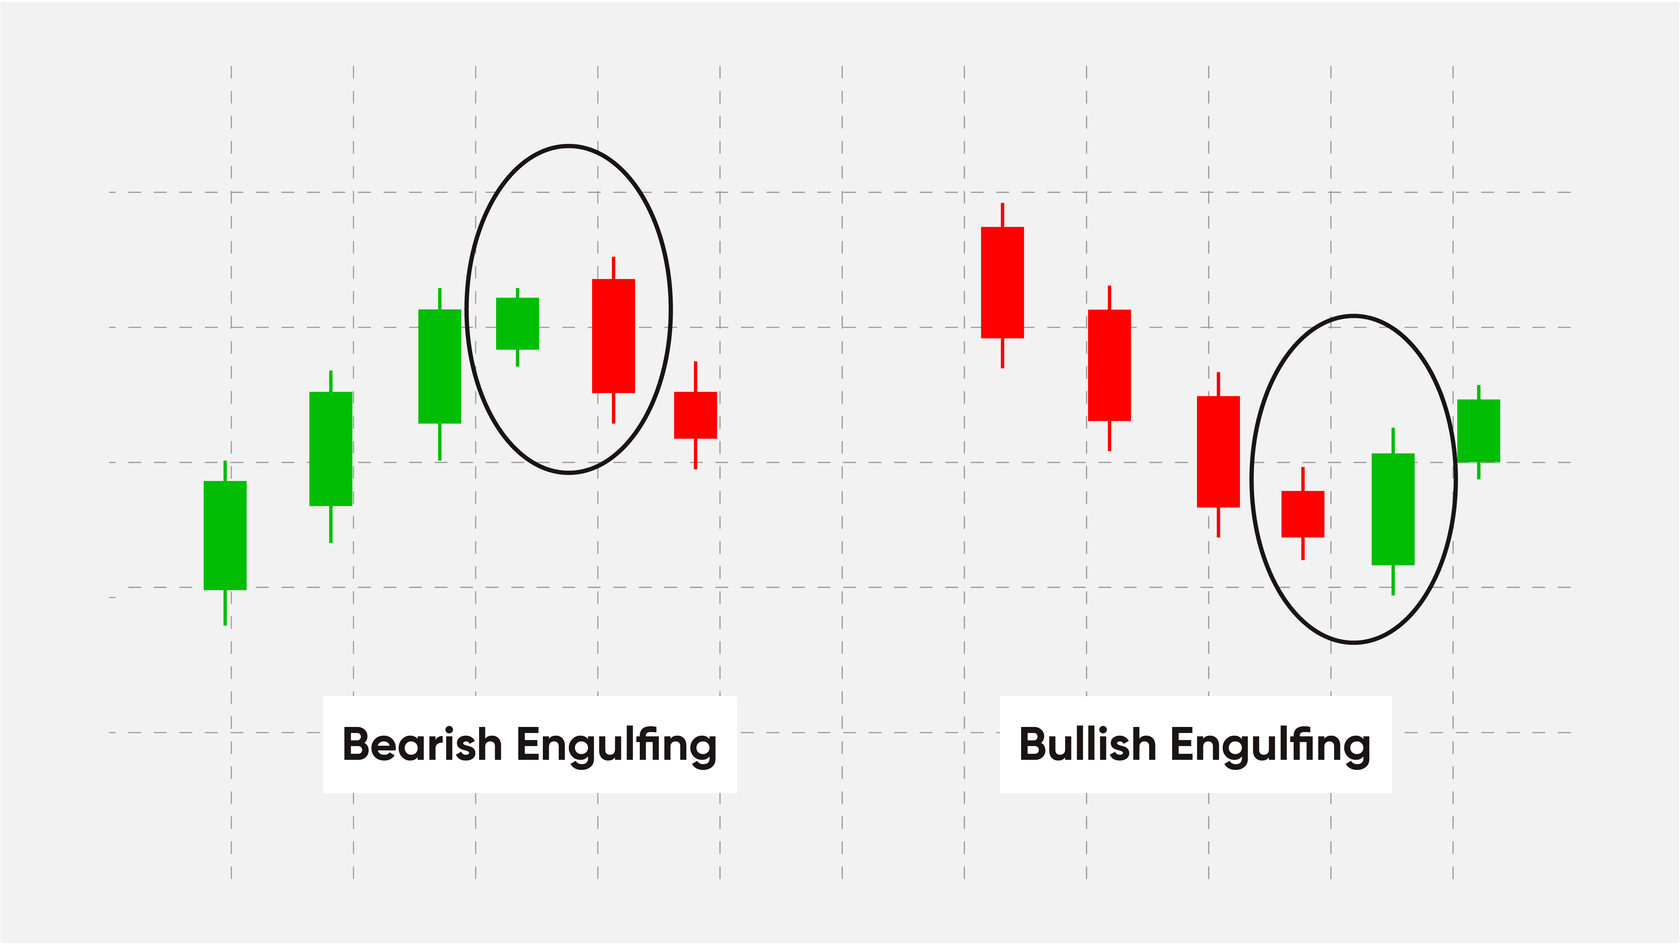
Engulfing patterns signal a strong reversal and are forming with two candles. The second bullish candle completely engulfs the first bearish candle. This means that sellers have lost their initiative after the recent downtrend, and the bulls are now in full control of the situation. Bearish engulfing, on the other hand, shows us the opposite situation.
Once we have mastered simple candlestick patterns, we can move on to more complex ones such as bullish and bearish formations with 2 candles or more.
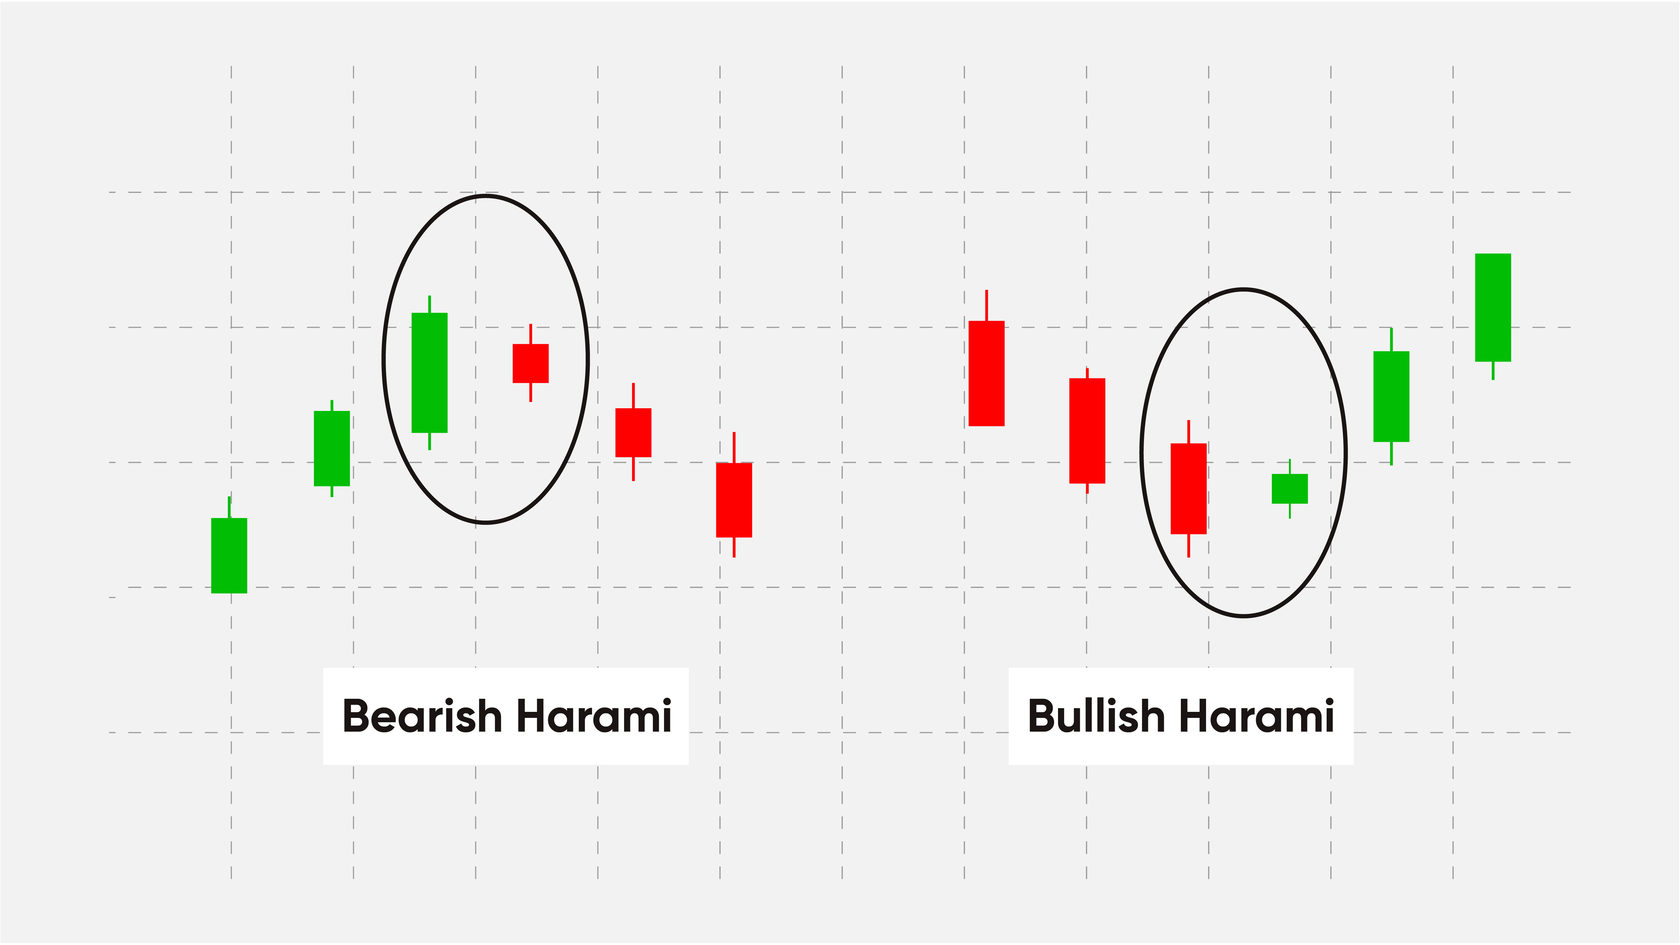
A Bullish or Bearish Harami may indicate reversal patterns. The word “Harami” means “pregnant” in Japanese. The second candle in the pattern must be contained within the body of the first candle, as seen in the images above. This holds for both bullish and bearish Harami. A downtrend precedes a bullish Harami, and an uptrend precedes that of a Bearish Harami.
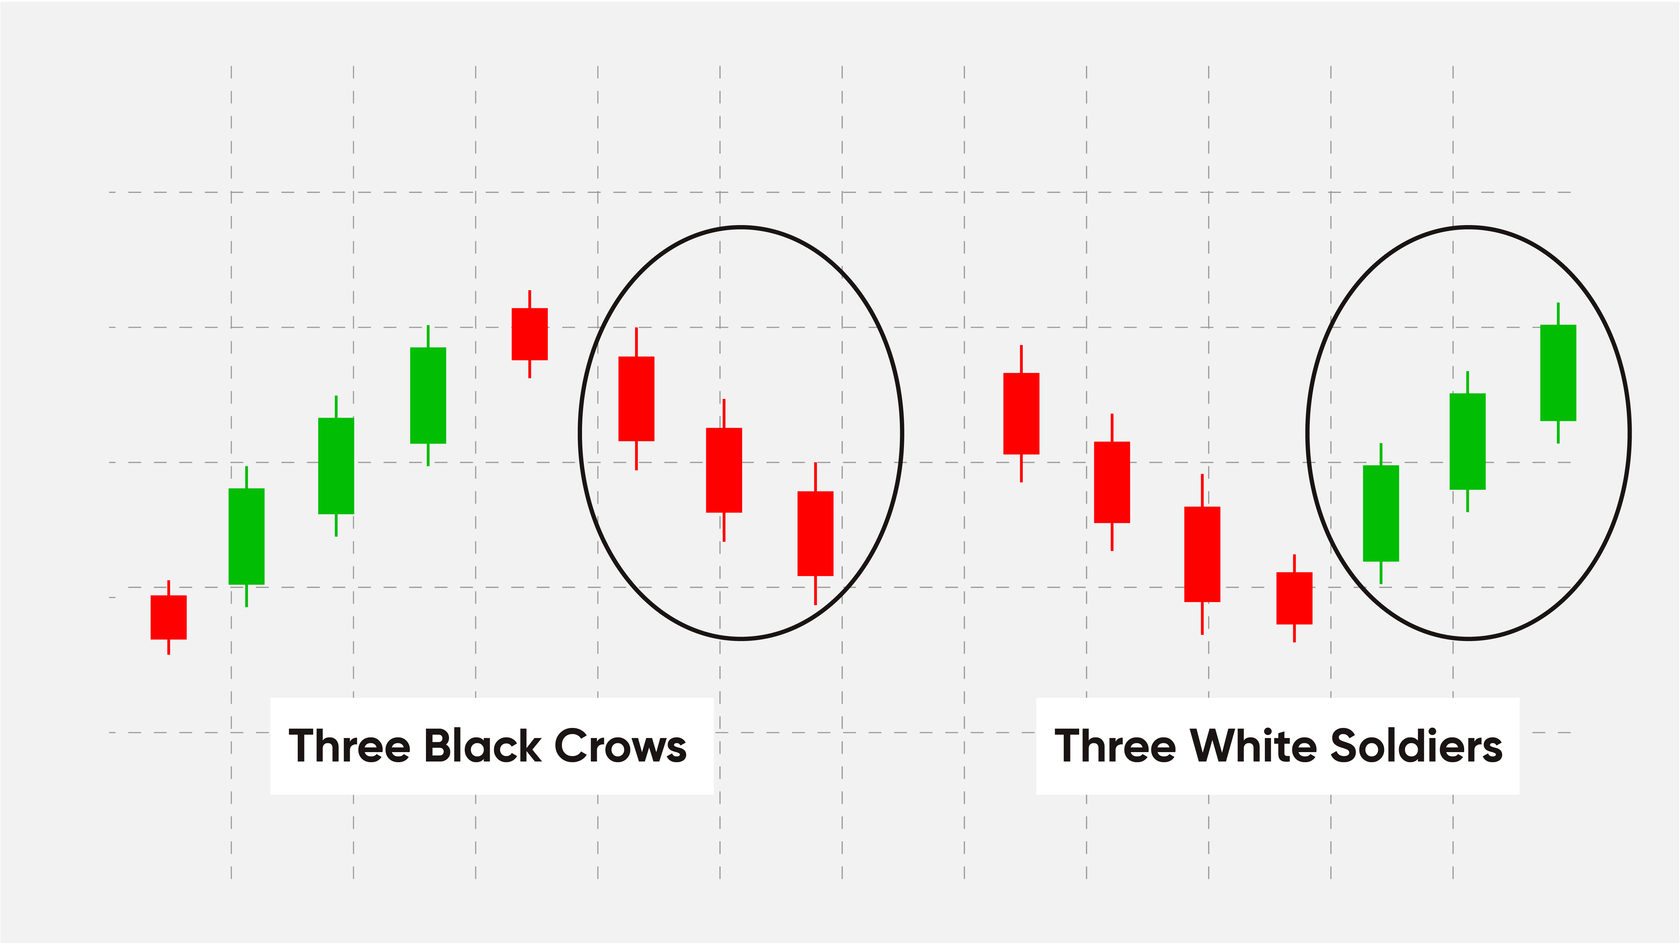
A three soldier pattern occurs when three bullish candles follow a downtrend, signaling a reversal. The three ravens pattern is the opposite of three soldiers. It is formed when three bearish candles follow an uptrend, indicating that the trend is likely to unfold.
Three soldiers is a strong reversal signal, especially when it occurs after a long downtrend. The first candle of three soldiers is called a reversal candle. She stops the downtrend. For the pattern to be considered valid, the second candle should be larger than the reversal candle. Besides, the second candle should close near its maximum, leaving a slight shadow.
Closing Remarks
The candlestick chart can play a decisive role in a better understanding of price movements and reading the flow of orders in financial markets. However, one should not make trading decisions based on only one pattern. It will be best to combine them with support and resistance levels, moving averages, or other indicators of technical analysis, which strengthen the signals for entering the market. Remembering many different candle patterns is not as useful as understanding what is actually behind their appearance and who is currently controlling the market situation - bulls or bears.Now you have learned a lot about trading patterns and tools, you can start trading on KickEX to implement the new insights efficiently!