Previously, we have briefly considered some TA indicators as an example, but in this article, we would like to define their effectiveness. All of them are classified, depending on what role they play. At the same time, a trader needs to understand for what purposes certain indicator is used. They can be divided into categories, such as leading or lagging. Leading indicators are oscillators that give their signals earlier than the price turns around. As for trend indicators, they follow the movement and never give leading signals. Oscillators show how much the market is currently overbought or oversold. Therefore, they can be used to identify potential signals for a market reversal. Such indicators are counter-trending.
Moving Average (MA)
Moving Average is one of the most popular and common indicators. Today there are many varieties of this auxiliary tool. The reason for its success is that this indicator is intended only to determine the trend and does its job well. MA smooths out small market fluctuations, giving the trader a complete picture of what is happening in the market. When a trend begins to take shape in the market, the moving average takes on a slope towards it. At the same time, the steeper the slope of this indicator becomes, the stronger the market trend.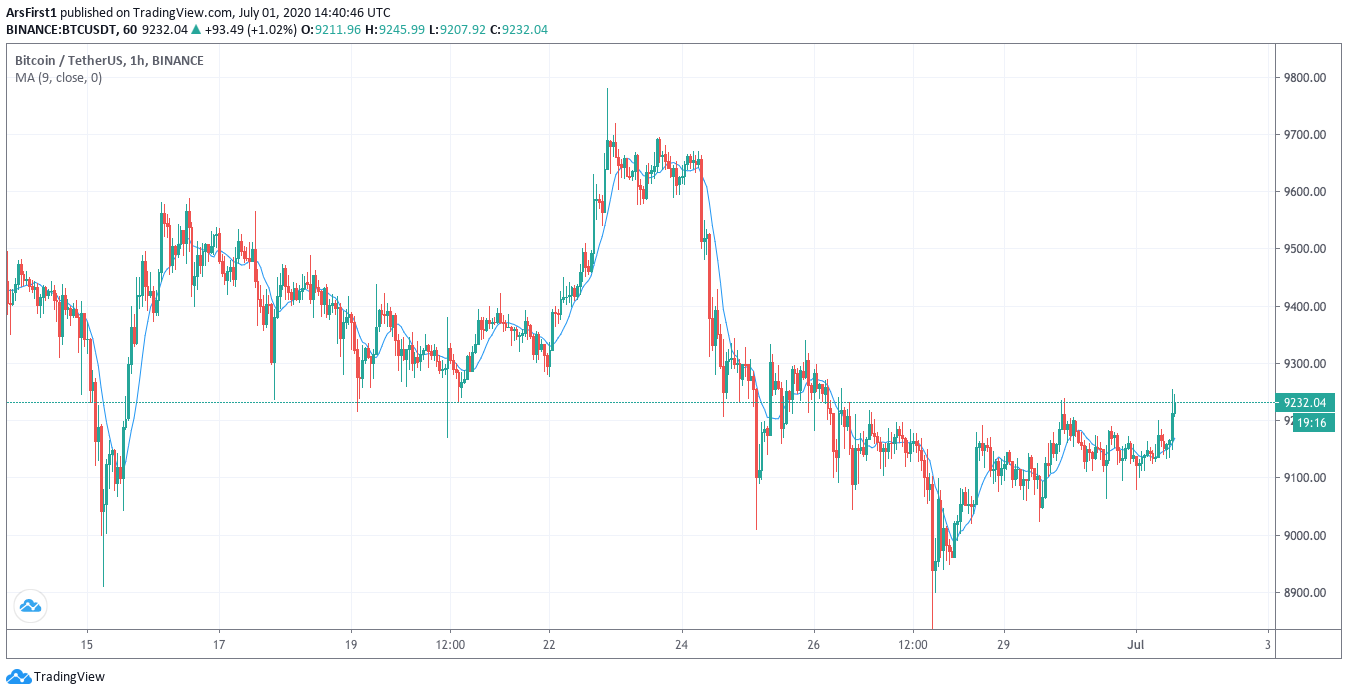
Moving Average is an excellent tool for trading on various time scales. It can be used by traders who trade both short and medium or even long-term. The basic moving averages play the role of support and resistance levels, and traders can use this trait to open their positions. Moreover, along with MAs, one can use other indicators to help make the forecast more accurate and open a position at the best price. It should be noted that this indicator is lagging. Its reverse occurs later than the price reversal.
Bollinger Bands (BB)
Bollinger Bands is a clear indicator, and its capabilities are not fully disclosed. To describe this auxiliary tool briefly, one can say that its bands are a kind of channel, inside which the price moves. It contains all the most important characteristics of price movements, such as direction, price range, and volatility. Bollinger Bands give an idea of future oscillatory movements either near the upper curve or near the lower.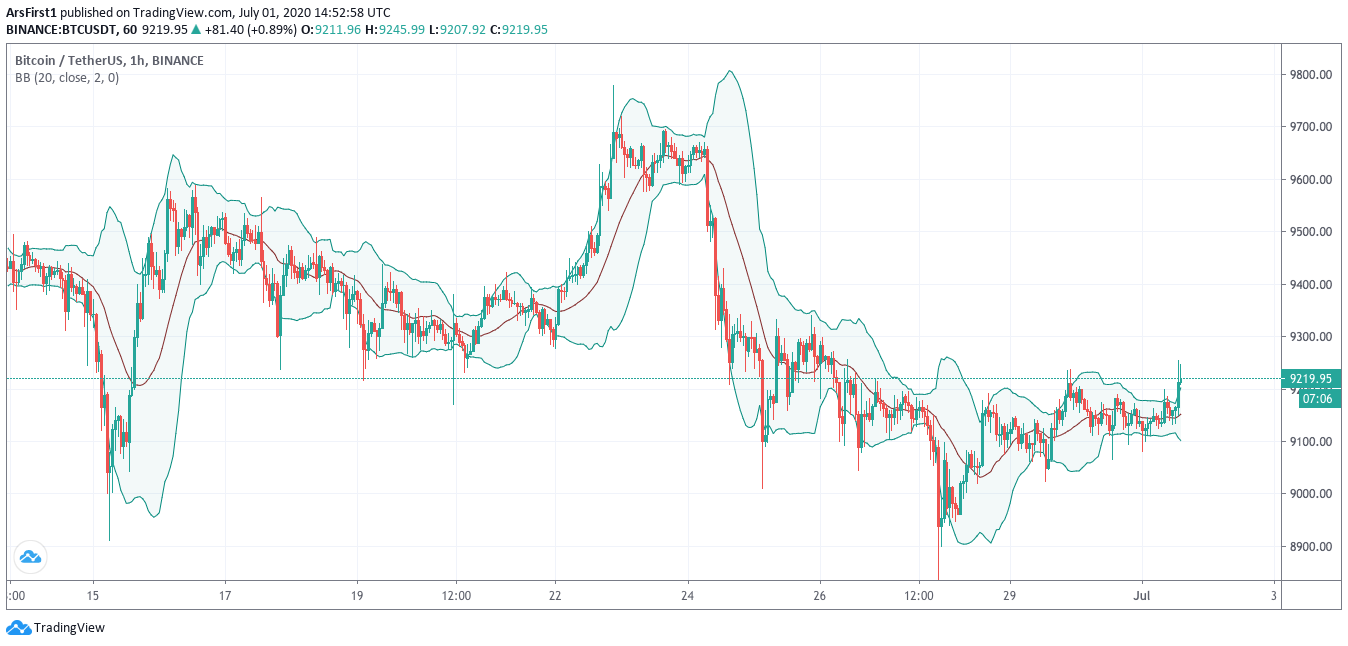
Notably, in most cases (about 90%), the indicator gives an excellent result. The idea of creating this auxiliary tool belongs to John Bollinger, who was the first to come up with how to use the so-called “price envelope” to measure the current volatility by the distance between the extreme bands. The idea of using such a tool appeared after observing how the price acts in certain ranges. If we consider the simplest bands, they consist of two curves (moving averages) that move up and down by the same amount. It is assumed that if prices remain calm most of the time, then it can be considered that when the price reaches one of the bands, it will most likely bounce off and go in the other direction.
Relative Strength Index (RSI)
The RSI indicator shows how much the market is overbought or oversold at the moment. It is a good tool that gives clear signals in most market situations. That is why it is considered as one of the best counter-trend indicators of our time. The creator of this indicator was Welles Wilder, one of the largest experts in the analysis of financial markets. He suggested using 14 days as settings. This period was taken as a basis, as a half cycle in most markets.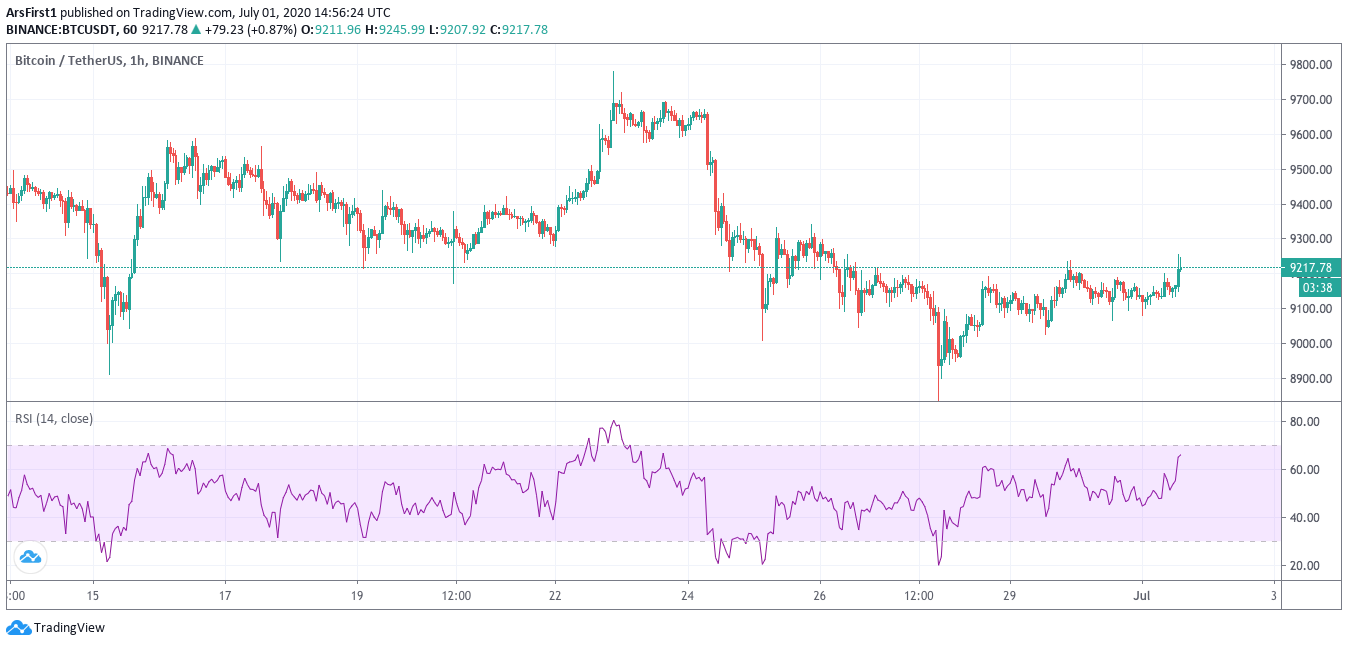
To assess the state, a channel with the recommended range is applied on the indicator (70:30) if the RSI line is higher than 70 - the market is in the overbought state, and if below 30 - in the oversold state. However, with a bullish trend, it is recommended to use borders (80:40), and with a bearish (60:20)
Moving Average Convergence Divergence (MACD)
MACD is a trend indicator invented by Gerald Appel that shows not only the average consensus of the masses but reflects the consistency of long-term and short-term trends. This indicator is used in two variations: MACD and MACD-histograms. The first one is used as a trend indicator, and the second can be used as an oscillator.The MACD indicator is based on three moving averages, while only two are displayed on the chart. The main curve - the MACD line - is the difference between the two moving with periods of 12 and 26. The auxiliary line (or signal) is an average with a period of 9.

When the MACD line crosses the signal line from top to bottom - it is a sell sign. If the main curve crosses the signal line from bottom to top - it is a buy sign. The important trading signals make it possible to focus on the trend all the time, i.e. speculate for upward during an uptrend or downtrend. It is better to focus on weekly price charts, as signals received on long time frames are considered more important.
Closing line
Some traders to perform profitable actions use a variety of indicators and their combinations. Others add custom indicators with more advanced features to their trading terminal. And the main solution is the fact that the best strategy and the best trading tools are the ones that fit individually. To determine this approach, we have offered you proven and effective indicators of technical analysis. Having dealt with them in practice, one can successfully identify the market trend and gain a benefit from it.Now you have learned a lot about trading patterns and tools, you can start trading on KickEX to implement the new insights efficiently!