
Qualified trader? Find the practical use of your skills and start trading on KickEX.
The history of the Elliott Wave Theory
The founder of the theory is Ralph Elliott. In 1934, his observations of the cyclical nature of price fluctuations finally came together in a mathematical model. Using stock market data as his main tool, Eliot discovered that the ever-changing stock market price trajectory writes out some structured pattern, which in turn reflects the basic harmony found in nature. Based on this discovery, he developed a rational system of market analysis. In short, the principle of waves is a catalog of models of price changes and explanations of where such figures are most likely to appear on the path of market development. Eliot's descriptions are a set of derived rules and guidelines for explaining market behavior. Eliot stated the prognostic value of this principle.Robert Prechter has popularized this theory. He also used wave theory to predict the largest fall in the Dow (October 2, 1987).
The essence of the Elliott Waves
According to the theory, after conducting technical and behavioral analysis, several models can be built at extreme points, according to which the price movement of the underlying asset shortly is determined. In all cases, these movements are cyclical in nature, namely, five cycles in the direction of the dominant trend and three against the main trend.The five waves are called Motive cycles, and the other three are Corrective. Such modeling significantly increases the likelihood of an accurate forecast with timely entry and exit from the market trend. That is why the Elliott wave theory is still considered not only in demand but also quite an effective tool for technical analysis of markets.
Working Principle
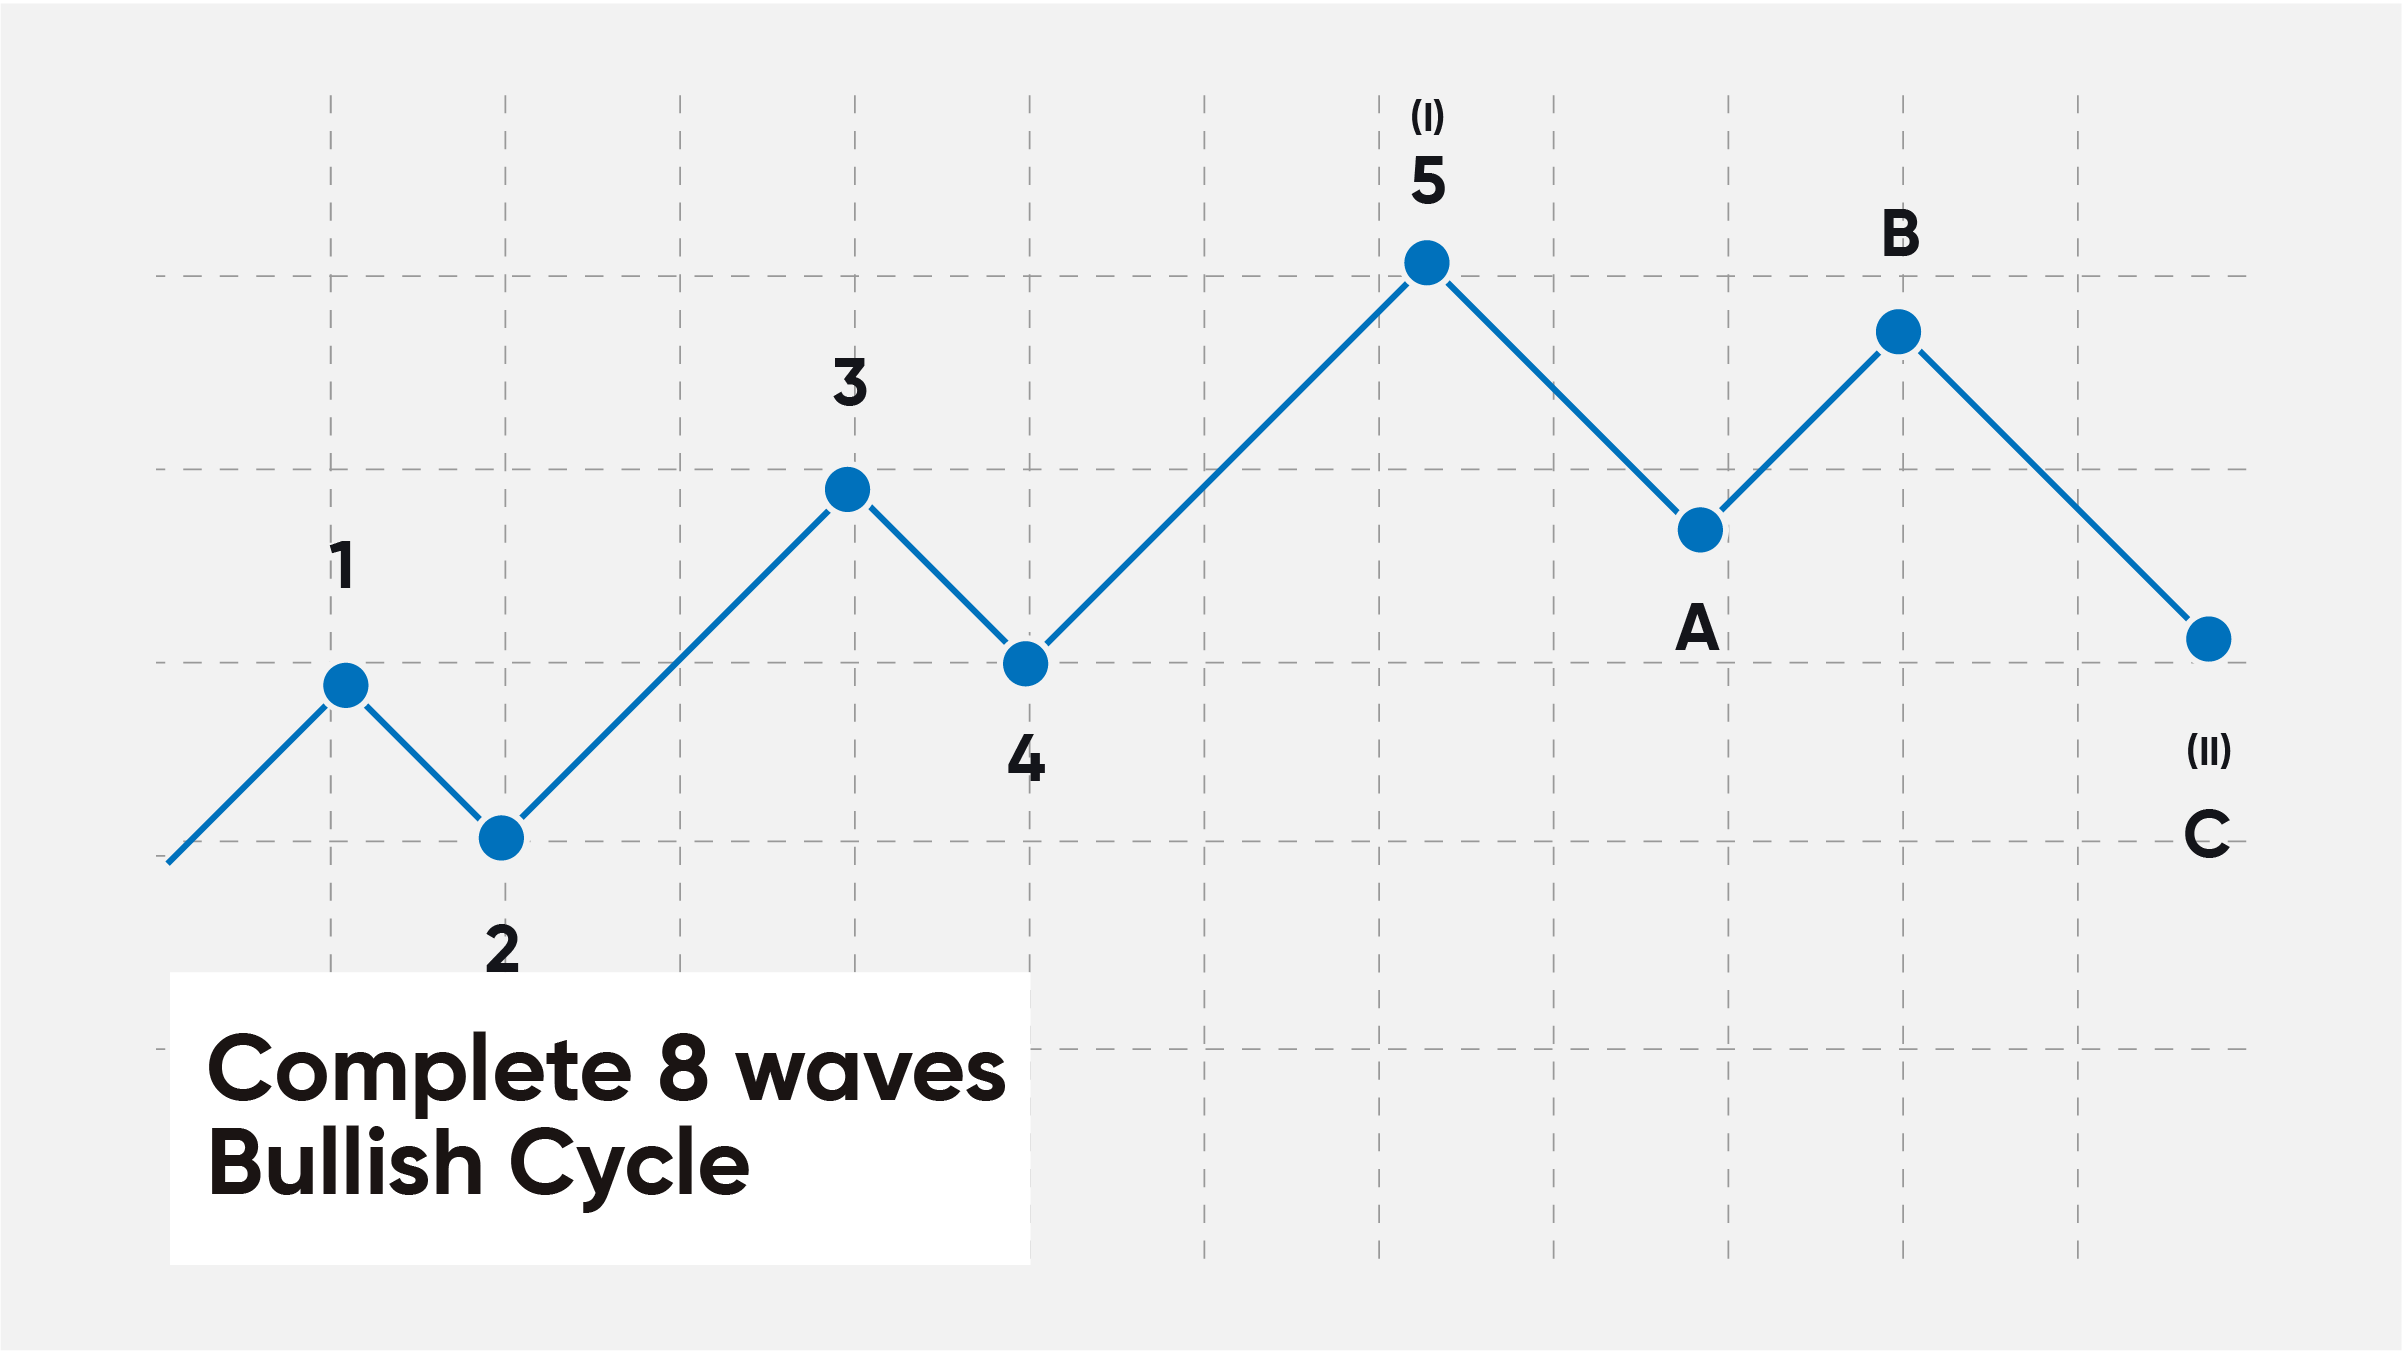
For ease of use, the first five pulsed waves are indicated by the numbers “1-2-3-4-5”, and corrective wave cycles are indicated by the letters “a-b-c”.If there is an uptrend of the bull market, the waves will be formed as follows:
Motive waves
Wave 1. Quotes are at the bottom, and traders are confident in the oversold market. Even a slight increase in prices entails increased demand with a quick purchase of assets.Wave 2. A small corrective wave of the temporary downward movement formed due to the negative expectations of a new strong market fall. In this case, investment psychology makes it possible to fix the possible profit due to Wave 1. The lower value of the amplitude of this wave cannot be less than the minimum parameter of Wave 1.
Wave 3. Powerful longest impulse phase, attracting the attention of most investors to the underlying asset. At this moment, there is dynamic growth in mass demand, which in all cases will be higher than the maximum amplitude and wavelength 1.
Wave 4. Another market correction after breaking through maximum quotes. The bullish sentiment still prevails, but prices are fixed around one upper value. The minimum value of Wave 4 never breaks the maximum value of Wave 1.
Wave 5. The last stage of the prevalence of bullish sentiment, which is at its peak. Feverish buying up of the underlying asset, even though the market can begin to fall at any time.
Corrective waves
Wave A. is the first movement of the corrective phase after reaching the maximum quotes of the underlying asset. The bullish mood in this period is mixed with fears that arouse the awareness of doubting traders. And these fears provoke a slow but steady price slide.Wave B. is the beginning of a bearish mood with the correction of the previous impulse cycle. The price of quotes during this period no longer rises to the highs of Wave A.
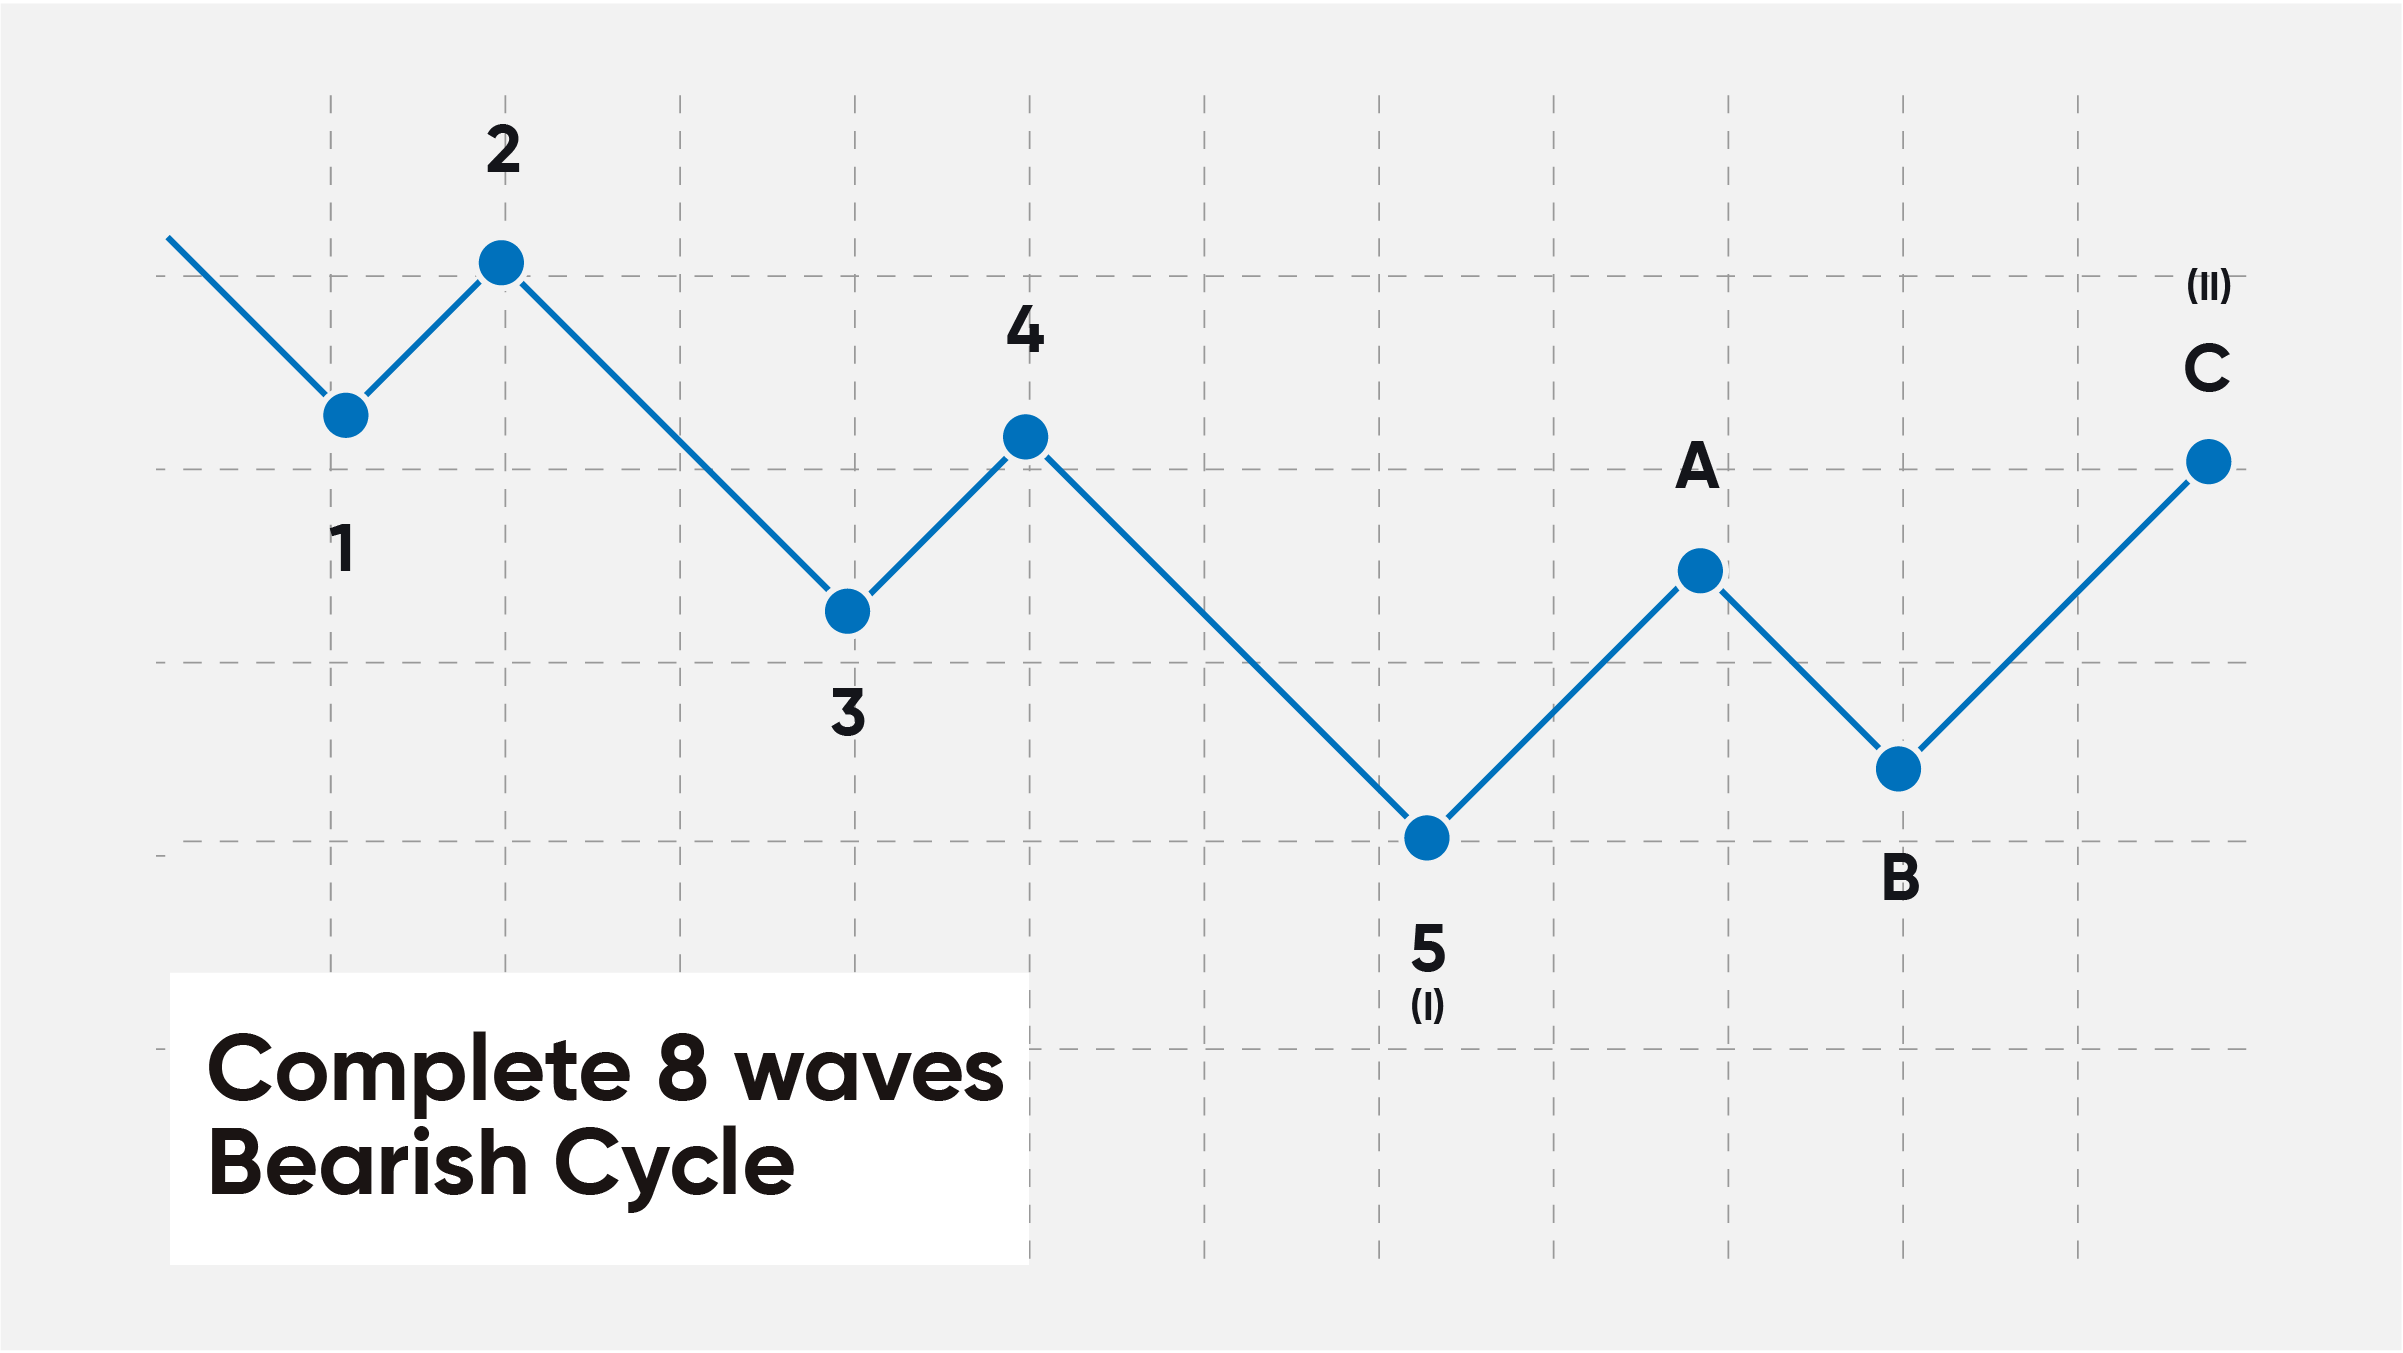
Wave C. is a confident bearish trend that takes prices beyond the minimum of the first corrective Wave A. And although a certain group of investors still relies on the “bullish reverse”, the bulk merges the underlying asset at a rapidly falling value.
In contrast, an Elliott Wave cycle in a bearish market would picture the opposite situation. It looks as follows:
Elliott Wave Trading Opportunities
The most accurate trend direction is determined during motive waves 1-2-3-4-5, rather than during the formation of corrective cycles a-b-c. To demonstrate a standard trading opportunity, let's look at an example:Bull cycle: Wave 3 and Wave 5. Having seen how the initial Wave is formed, the trader can prepare to ride Wave 3, which has a maximum duration in time. The main thing is to track the moment when Wave 2 ends, which, as we already know, cannot be less than the minimum of Wave 1. A similar tactic can be applied to Wave 5, which should be prepared immediately after the start of Wave 4.
The use of Elliott waves is especially effective when setting Stop Loss and Take Profit. For example, knowing that Wave 2 will not fall below the minimum of Wave 1, a trader can set a stop loss just below the minimum of the first motive wave. By analogy - Wave 4. This means that when trading on Wave 5, the optimal point for placement will be slightly below the maximum of Wave 1.
Closing line
Elliott wave theory is an accurate tool for predicting market behavior, although it does not guarantee 100% of the result since market science is more a probabilistic science. A trader needs to prepare very carefully to correctly recognize the waves and their levels: a correction of the rising wave, or a downward impulse?A great addition to this analysis can be the use of Fibonacci tools, Moving Averages, Oscillators, and Indicators.