Technical Analysis (TA) is an indispensable tool in the digital currency trading market. One of the first to notice asset and market trends and the possibility of their segmentation was the founder of The Wall Street Journal, Charles Dow. As a result, technical analysis, as a tool for predicting eventual price movements, began to be widely used at the beginning of the 20th century with the advent and development of computer technology.
TA is a world-wide practice in the trade as it is a tool and method for analyzing financial markets to choose an investment strategy. The analysis is based on previous data on price movements, volume, moving averages, and various outcome statistics.
What’s the difference between TA & Fundamental Analysis (FA)?
Both analyzes are actively used by investors and traders in the course of their activities to predict the future financial situation and the effective investment of their funds.
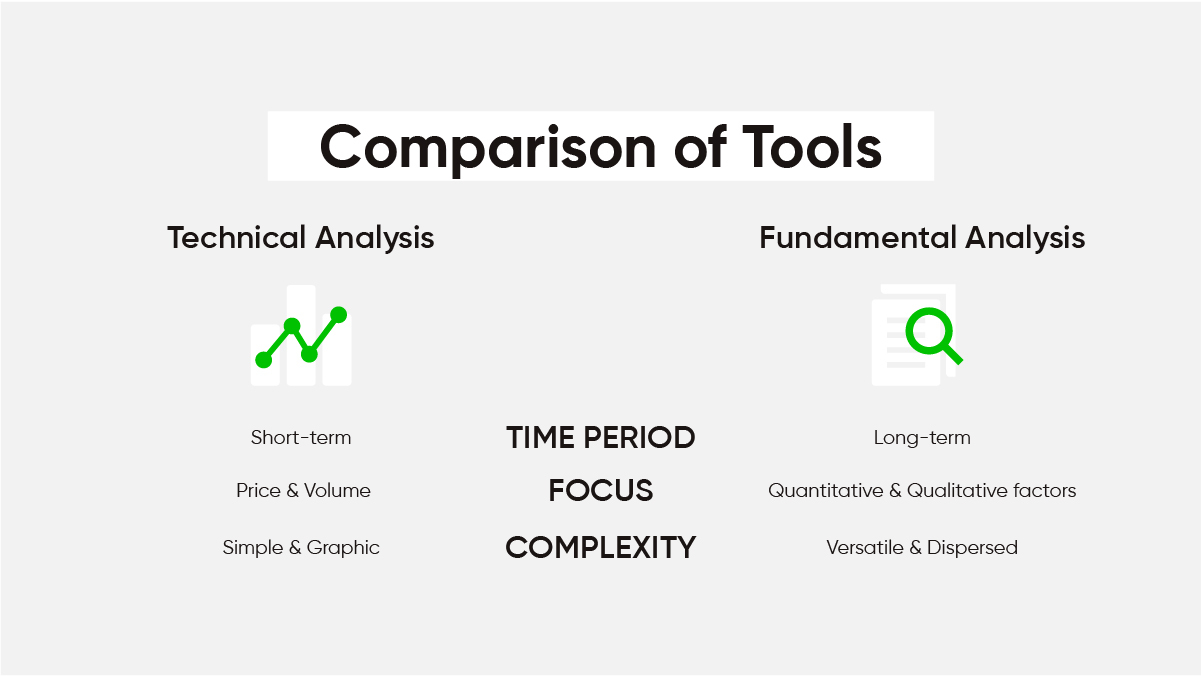
The qualitative difference is that fundamental analysis (FA) aims to identify long-term trends based on the main parameters of the enterprise’s functioning and assessment of stock potential, while technical analysis (TA) tends to study the movement of prices for specific stocks, identifying pricing models.

A clear advantage of technical analysis is that it relies on a large amount of statistical data. This provides the basis for an objective study of price history, eliminating some assumptions and guesses that are taken into account in fundamental analysis. However, if we consider the activity of specific traders, the subjectivity can often be present in their work with TA.
Insight on TA & Indicators
The technical analysis considers supply and demand in the market, based initially on the assumption that changes in asset prices are not random and, over time, form their own tendency. The idea of this repeatability lies in market psychology, when, for obvious reasons, certain emotions turn out to be quite predictable. That is why the long-term study of pattern diagrams made it possible to understand the relationship between emotions and market movements.
The effectiveness of TA is determined by the reliability of the market, which is ensured by its high volumes and liquidity. A large market is less prone to manipulation and false signals, that is why technical analysis can be suited to use.
Market price research is carried out with the assistance of charting tools, namely indicators of technical analysis. They contribute to the identification of trends and, in their entirety, help to reduce possible risks. Trend indicators can tell which direction the market is moving in if there is a trend at all. They are sometimes called oscillators because they tend to move between high and low values like a wave.
Among the many indicators of technical analysis, “Simple Moving Averages” (SMAs) are the most commonly used. SMA is calculated based on the closing price of an asset over a specified period of time. It has a modified version called “Exponential Moving Average” (EMA) that takes into account the latest prices of closed transactions.

Source: investopedia.com
Another common indicator is “Bollinger bands”, which is a volatility indicator. It is used to trade in both ranging and trending markets. The indicator consists of a simple moving average, and 2 lines plotted at 2 standard deviations on either side of the central moving average line.

Source: investopedia.com
Next up, the “Relative Strength Index” (RSI), which is part of a class of indicators known as oscillators. Oscillators apply mathematical formulas to price data and then produce readings that fall into predetermined ranges. A single line scaled from 0 to 100 identifies overbought and oversold conditions in the market. Readings over 70 indicate an overbought market, and readings below 30 indicate an oversold market.
Also, there are some indicators of TA that are based on other indicators for obtaining data. For example, a “Moving Average Divergence Indicator” (MACD). It is generated by subtracting two EMAs to create the main line (MACD line). The first line is then used to generate another EMA, resulting in a second line. In addition, there is a MACD histogram that shows the difference between two lines.

Source: investopedia.com
Indicators are not only a tool for tracking market trends, but they are also potential signals for buying/selling assets. One should understand that it is not always necessary to strictly follow them, as TA indicators can also display false signals. This can be especially true for the cryptocurrency market, which has not yet reached the stability of traditional markets.
The Concluding Part
Technical Analysis is a good tool in the right hands, which is much easier to master than the FA. Its benefit is that it can provide insightful information into short-term market conditions, which may be useful for both traders and investors. A good way to analyze is to use a combination of indicators, which will give greater confidence in the positions, avoid fraud, and generally earn more money. Success depends on the regular practice of searching for signals and adjusting indicator settings. Ultimately, this will allow to find your own gold combination and strategy for conducting successful trading.


