Backstory
Back in XIII, European mathematician Leonardo Fibonacci created the famous sequence of numbers that was called "The Golden Ratio". Its essence is that the subsequent numbers of the series are the sum of the two previous ones, and the ratio of any number in the series to the previous one is approximately 1.618.The Fibonacci sequence is as follows:
0 , 1, 1, 2, 3, 5, 8, 13, 21, 34, 55, 89, 144, 233, 377, 610…
The mathematician described this sequence to determine the "ideal rabbit population", calculating how many rabbits appear at certain intervals, given that each couple is ready to give offspring in the second month of life. Later it was noticed that in nature, many processes and phenomena quite well fit the Fibonacci concept. This sequence has also provided significant assistance in conducting trading on the exchange.
Fibonacci Retracements
There comes a day when an entry-level trader faces a challenge of building a Fibonacci grid. And at first, it is difficult and incomprehensible. Let's look closely and answer the following: what are the Fib Retracements, ways to find points to open/close positions and how to define goals, and build charts.Let’s take a look at the average uptrend:
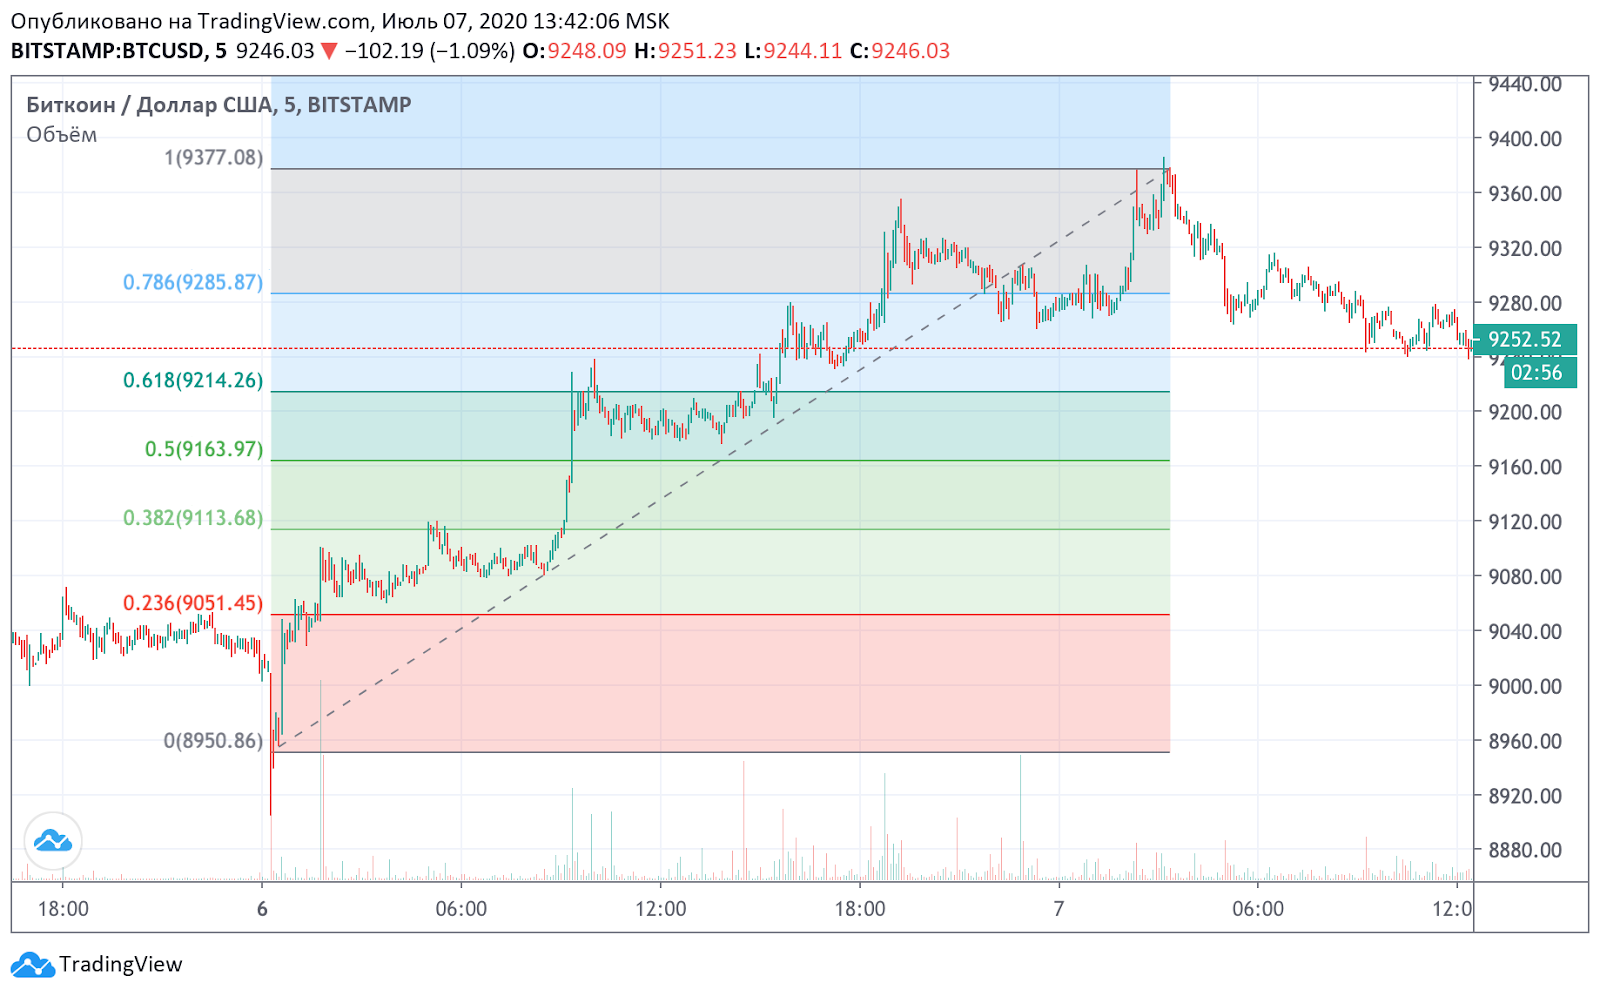
With a rising price, we need to determine at what point it is better to start buying, and when to open an order. Using the grid, it is possible to obtain probabilistic points where the movement of the observed chart will again change to further growth. This will allow us to calmly enter the position and stay in profit.
After waiting for the next upward price movement, when it is supposed to continue the uptrend, one needs to determine the entry point. Having studied the uptrend, one will need to find the lowest point preceding its growth and “stretch” the grid to the place where, according to our assumptions, the retracement began.
It is considered that the deeper the retracement, the lower the potential for the subsequent movement, since with the development of a deep retracement (over 50%) for an uptrend, the desire of the participants to sell is very high, which can complicate further price increases, and with a retracement for a downtrend over 50 % the desire of participants to buy is also very high, which creates an obstacle to further price reduction. Conversely, with correction levels of up to 38.2%, the development of further price movement in the direction of the dominant trend is most likely, since the strength of the opponents of the movement is small.
Fibonacci Extension
There is another good tool called the Fibo extension. It is needed to indicate targets on unknown trends. For example, one needs to determine which probabilistic levels for profit taking are better to choose if you have already purchased, and by what signals it is better to exit.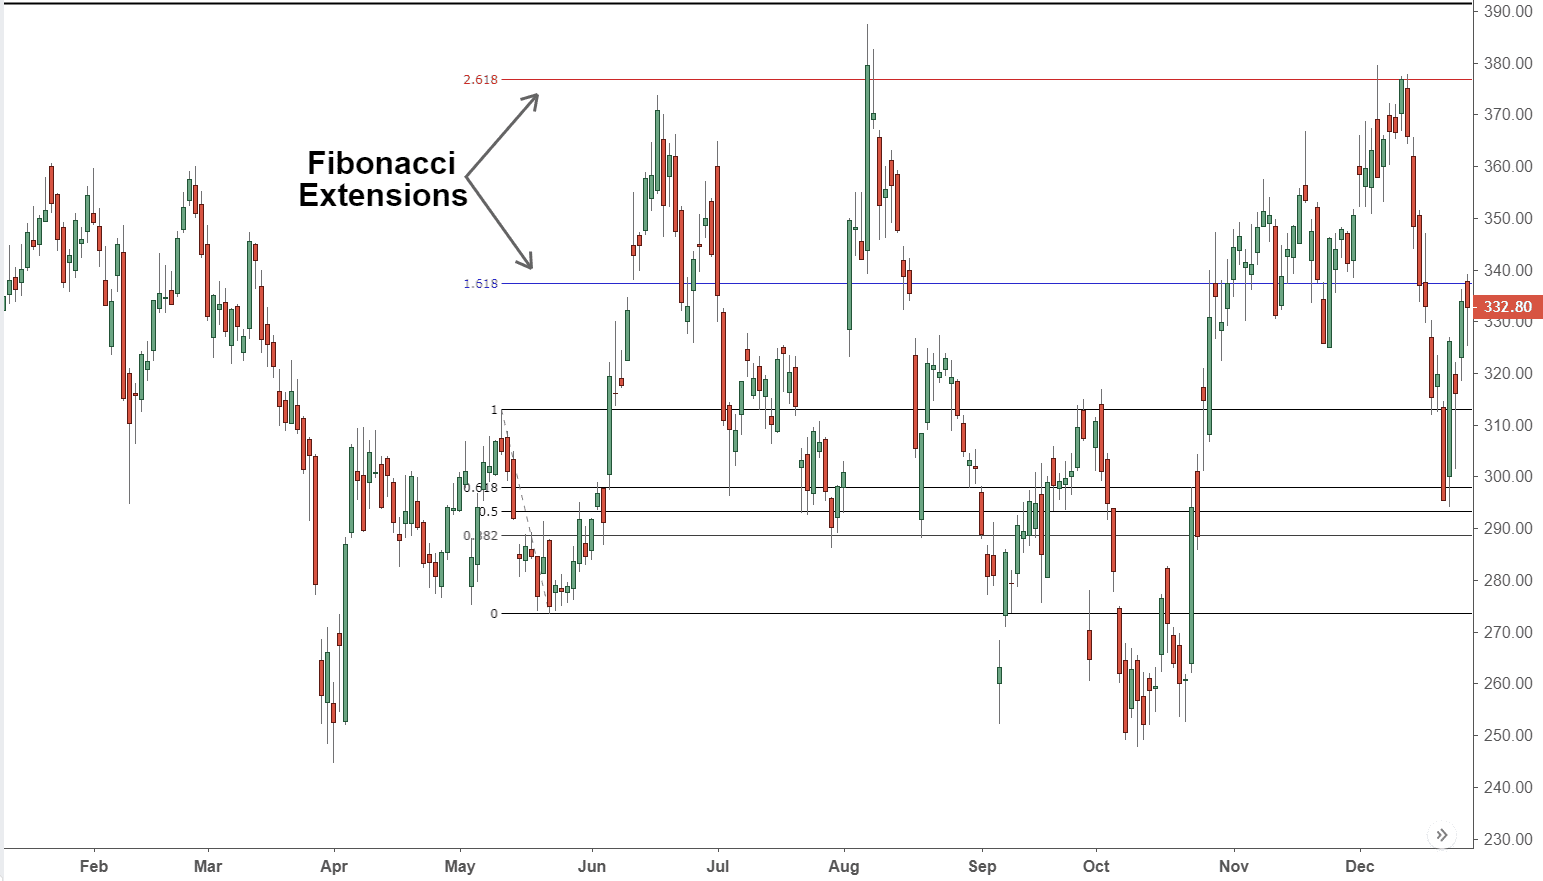
By default, it has levels of 61.8%, 100.0%, 161.8%, which are built from a segment of the first section of the trend, delayed from the point of completion of the first retracement. The Fibonacci extension also adds a new level of 50%, since it is often taken into account by price. The Fibo extension will quite accurately build you points, after which retracement will begin. These will be the best points in the chart to take profits and exit the positions.
Similarly with a downtrend.
Fibonacci Fan
This is another popular technical analysis tool based on the Fibonacci Retracements mentioned earlier. It is also used to identify potential support and resistance levels, as well as possible trend reversal zones.Graphically, it represents several oblique lines emerging from the starting point of the price impulse. These lines go through several key Fibonacci retracements, including 38.2%, 50% and 61.8%.
The fan trading strategy is essentially the same as with the Fibonacci retracements. The only difference is that these levels are not displayed horizontally but at a certain angle.
Closing Remarks
Using Fibonacci tools in cryptocurrency trading, one can determine:- the moment when the retracement begins;
- further potential;
- strong levels of support;
- strong resistance levels.
Of the 5 Fibonacci levels actively used in trading, three have the greatest strength - 0.382, 0.5, and 0.618. It is at their intersection that resistance and support are greatest. Focus on these numbers and take timely action, since it is upon reaching them that the course direction changes. And always remember that In the context of modern cryptocurrency trading, Fibonacci tools are used in addition to other market analysis methods.
Now you have learned a lot about trading patterns and tools, you can start trading on KickEX to implement the new insights efficiently!