In this article, we describe the fundamental components of any market, whether it’s the stock market, forex, or cryptocurrencies. Each novice trader must be at first familiar with all the possibilities of working with the market and later improve his skills. It is no secret that the modern format of interaction with the market falls on the digital space, and therefore, all kinds of utilities and indicators can increase one's productivity.
What is the Market Depth?
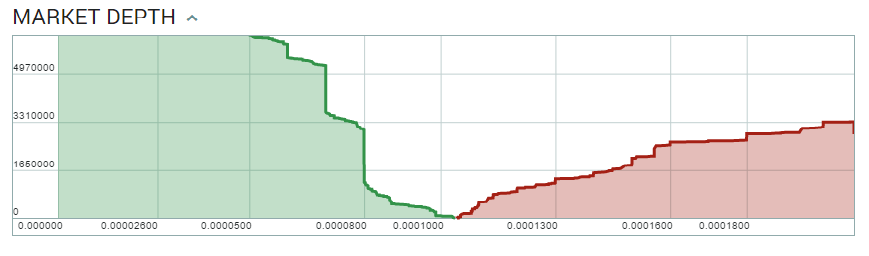
In simple terms, Depth of Market (DOM), also known as the order book, is an indicator that reflects the mood of bidders and is one of the most important tools of any trader. Visually, it is displayed as a list with digital indicators of current orders to buy/sell a specific asset at prices set by the participants.
Through the examination of this indicator, one can analyze the level of demand and supply, and give a short-term forecast, which is subsequently used in “scalping”.
Scalping — is a strategy of making a profit on short time scales. Advanced traders use it focusing on many market factors, which allows them to extract income from intraday price fluctuations. At times of high volume on the market, a large number of orders appear, which are structured by DOM. The tool displays all open orders, which will further affect the pricing. It helps to evaluate the superiority of demand and supply and determine the most liquid price level.
The order book has the following features:
A graphical representation of available liquidity on each priceline
All orders are displayed only with a set cost
Each order has several sellers and buyers
It does not distinguish between stop orders for closing positions, orders for opening and purchases on borrowed funds
The Effectiveness of the DOM
The approaches to the implementation of trade are constantly being improved by market participants, and therefore more updated trading strategies constantly arise. That is why today traders use the Depth of Market to a lesser extent then they used it relevant earlier. The point is, that despite the useful properties of this indicator, processing such a huge array of orders is an uncomfortable moment in the work, which also makes it difficult to assess the current trading situation. Often there are some hidden and fictitious orders, which negatively affect the productivity of inexperienced traders. The advantage of the book of orders usage remains, but it is achieved through the combination of the chart and the order tape (time & sales). That allows users to identify the target stock within a certain price range.
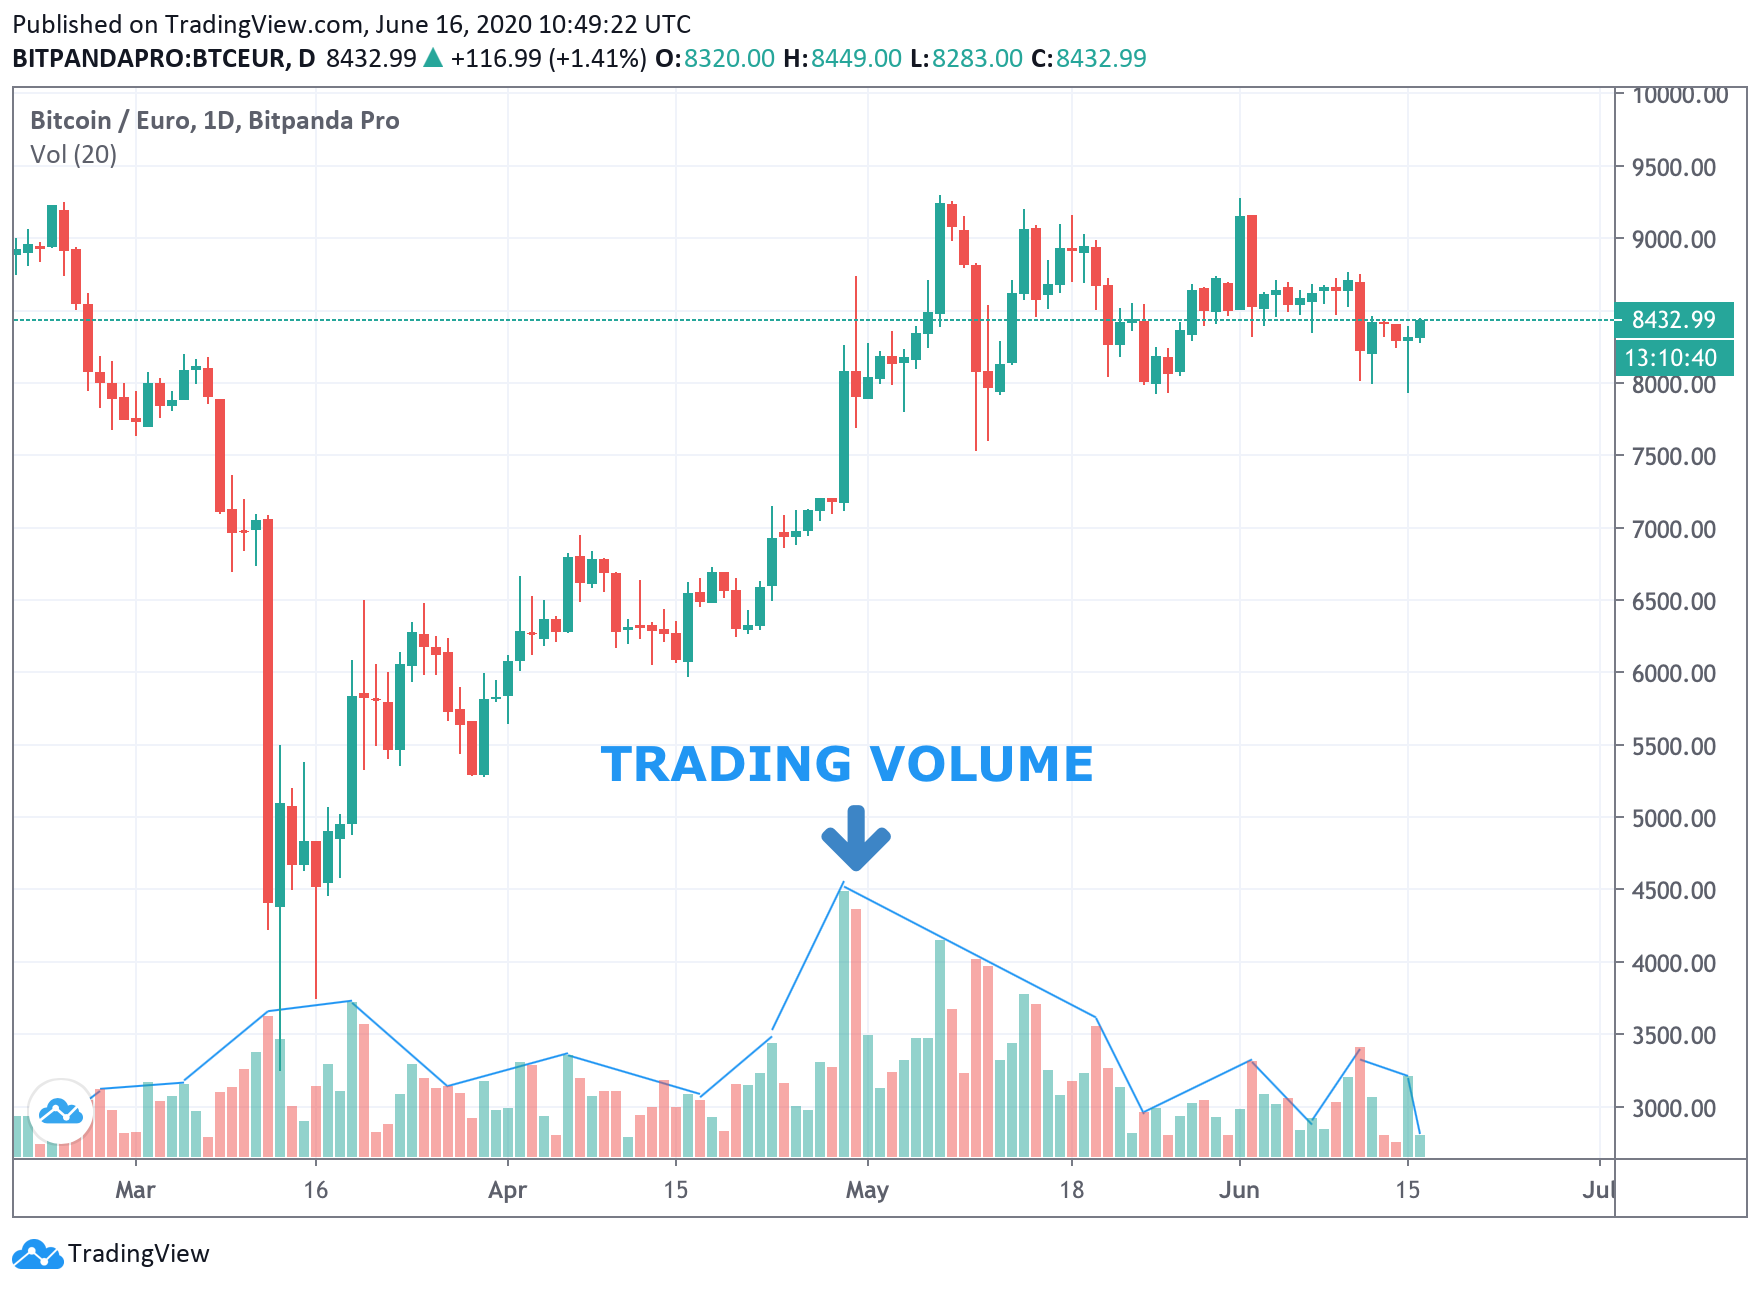
The Importance of Trading Volume
Trading volume is one of the most closely watched indicators for tracking the general activity of the market, which shows the volume of purchase and sale of securities. It is the total number of stocks, bonds or commodity futures contracts sold over a given period. Daily, exchanges publish data on the volume of trades, both for individual transactions and the total amount of trades completed on the exchange. The trading volume shows market liquidity, as well as supply and demand for securities. It also reflects price dynamics. When a market activity is low, investors expect a slower moving of prices. When market activity rises, prices usually move in the same direction. A low level of security may indicate a lack of confidence among investors. It can generate price volatility and mirror factors that, from an investment point of view are untrustworthy. In contrast, the high volume of a particular security may indicate that traders trust investment in the long run. It also gives investors more time to determine when it’s the right time to sell for a profit.
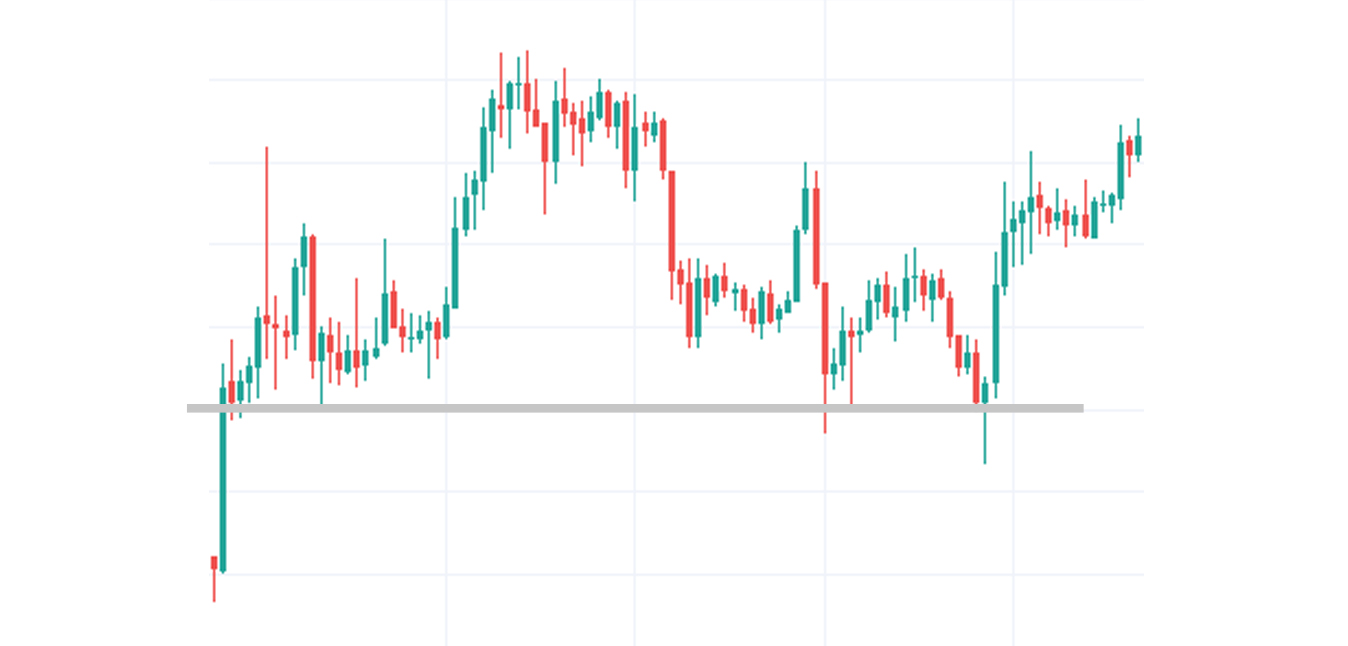
A Build Stage of Support & Resistance
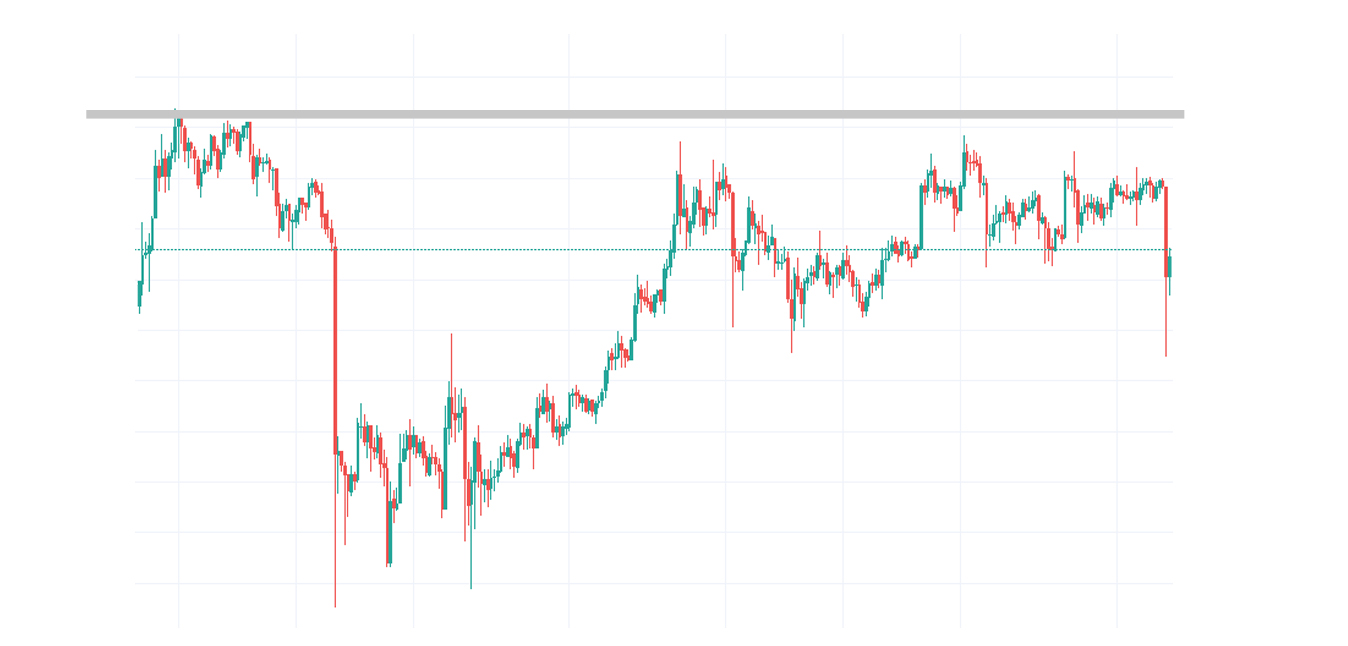
The concept of support and resistance lines is extremely simple and serves as the basis for technical analysis. This toolkit is located in the list of the most constantly used by traders. In this connection, any beginner needs to understand the point.
Support is the ground level at which buyers control prices and prevent their further decline. Resistance is the level at which sellers control prices. Support levels reflect the price, which gives the investor hope for an increase. Resistance levels are the opposite (top floor) — they show the price from which the investor expects a decline. Traders use these lines to determine the strength of the trend, that is, the rise or fall of the price. An uptrend with a breakout (movement through an identified level of support) signals a high probability of further growth in the price of an asset, and a downtrend is, respectively, an opposite situation.
The support and resistance lines are classified according to four main parameters:
Time-scale
Length
Number of turning points
Slope angle
The larger the time-scale is, the more important the line. Accordingly, the lines on the month chart are more important than on the daily chart.
The duration of the constructed line of support or resistance is also of great importance. The longer it is, the more reliable it is as a reversal signal in case of breakdown, and the less reliable it is as a guideline that accompanies the current trend.
The same can be noticed about the number of turning points. Their amount displays the reliability and potential of the current positions during the analysis. The slope angle between the line and the horizontal axis shows the trend of the market and the underlying sentiment. The steeper the line, the faster the trend is developing.
Closing Line
The trading tools considered above are the starting point in working with the exchange. Certain practice and constant improvement of one’s skills are required to achieve high results of professional traders. The best option is to combine existing indicators to identify more accurate market performance. Only multiple strategies and tools tend to provide the best opportunities.
One should always remember that there all kinds of risk factors that should be taken into account and protect his capital from adverse price fluctuations. Even the strongest-looking setups with the best entry points have a chance to change their trend.