The need for optimal options for financial markets analytics forces traders to constantly improve their knowledge and experiment with trading strategies. This is the right approach, but it is worth noting that the key to success sometimes lies in the time-tested classic indicators that can surpass fashionable methods in efficiency.
Today we are talking about the MACD indicator, which can be found in any trading terminal and that has proven its "professional suitability" by many years of practice on exchanges. With this tool, professional and novice traders can assess the strength and dynamics of a trend and receive clear signals to enter/exit the market.
Already have all the expertise necessary for trading? Use your knowledge and skills on the KickEXexchange! Make a profit today!
Background
The history of the MACD indicator began in 1979. The tool was developed and used by Gerald Appel. The author of the development is a trader, analyst, and investor. Since 1973, under his leadership, one of the most famous publications in the field of technical analysis has been published - "Systems and Forecasts". Theoretical developments began to be introduced into practical trade. Appel manages the investment company Signalert Corporation, which is entrusted with funds for more than $ 550 million.
The development was intended for the analysis of the securities market (stocks). The advantages of the indicator were appreciated by traders working in other directions. As a result, the tool has become one of the most common in dynamic markets, including Forex and cryptocurrencies.
Initially, MACD trading was based on the construction and analysis of 2 lines. In 1986, Thomas Aspray proposed adding a histogram to the indicator window, which expanded the possibilities by visualizing leading signals.
General description
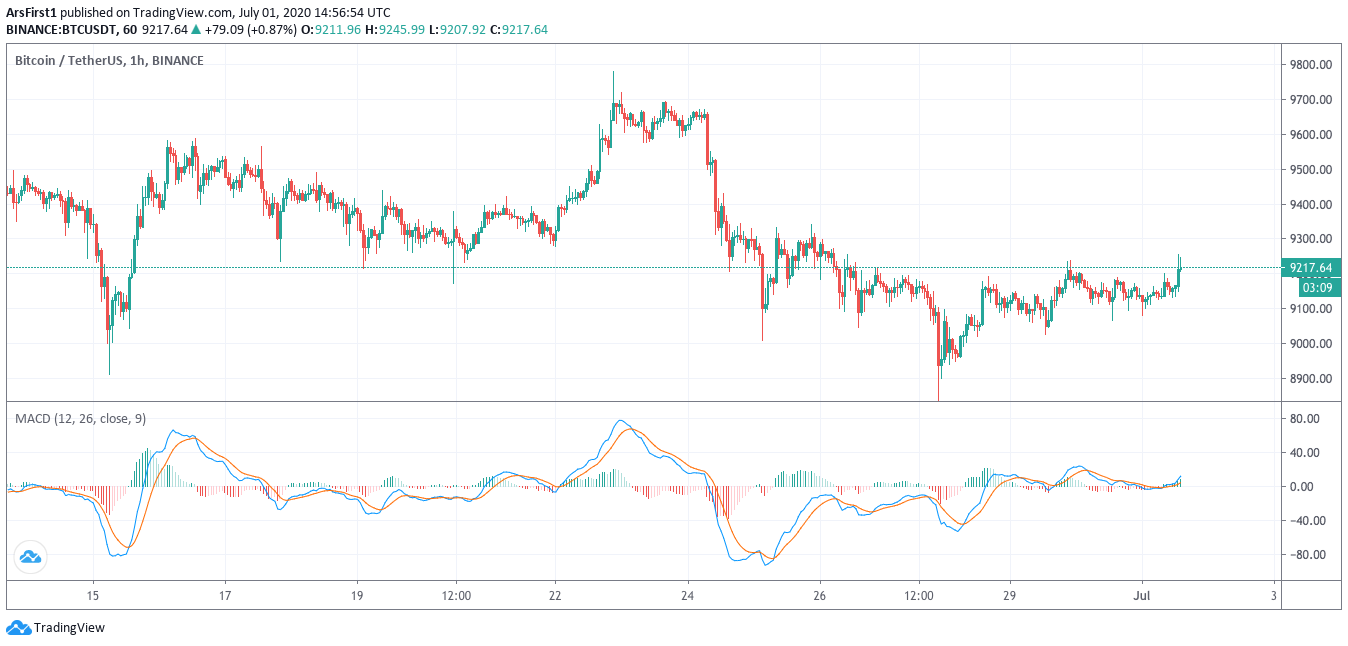
The Moving Average Convergence Divergence (MACD) is an oscillator type indicator that is used for technical analysis (TA). It is presented as a separate window under the chart in the workspace and is depicted as a diagram with vertical bars and a signal line. There are no usual overbought or oversold zones; signals come exclusively from the chart. There is only a zero mark as a horizontal reference point - the columns are built on opposite sides of it, that is, either up or down. It is quite convenient, just one glance is enough to quickly get presented information about the current state of the market and evaluate possible scenarios. Ease of use and versatility are the main advantages of this indicator.
Working principle
We know that the shorter the MA period, the faster it reacts to recent price changes. Thus, two moving averages (fast and slow) will either diverge or converge, sometimes crossing. This is what lies in the core of the MACD indicator.
It consists of three elements moving around the zero line:
The MACD line helps determine upward or downward momentum (market trend). It is calculated by subtracting two exponential moving averages (EMA).
MACD = EMA (F) - EMA (S)
The signal line is an EMA of the MACD line. The combined analysis of the signal line with the MACD line may help spot potential reversals or entry and exit points.
Signal = EMA (MACD)
The histogram is a graphical representation of the divergence and convergence of the MACD line and the signal line. It is calculated based on the differences between the two lines.
Histogram = MACD - Signal
How to read MACD charts
Conventionally, all MACD signals can be divided into two groups. The first consists of confirming the trend, the second is intended to determine the reversals or to determine its probability and exit from the position according to the current trend. So, in the first group, the following can be distinguished:
The transition from positive values of the chart to negative or vice versa. This usually means that the fast-moving average has reversed and follows the new direction of the market, at the moment when the zero line is crossed, the crossing of these movements also occurs. It is better to use it on periods and in market phases when there is no pronounced sideways movement. Also, very often this signal is used in trend strategies in the form of a filter, the entry is made after there is such a confirmation.
Changing the size of the bars in the chart. Another signal that is extremely easy to use. If the range of bars is consistently growing, then there is a trend in the market and it is actively developing. A growing upward chart of the MACD indicator indicates a bullish trend, a growing downward - about a bearish one. A decrease in the size of the bars of the MACD indicator chart indicates that the trend is beginning to fade and a reversal can be expected, or that there is a correction or a movement in the opposite direction begins.
Signal line entry into the body of the diagram and exit from it. In the first case, this signal of the MACD indicator is trend confirmation, in the second, it indicates the likely end of the trend. It is usually used as a filter or an additional confirming factor.
Reversal of the chart. One of the main reversal signals of the MACD indicator. After the bars stop growing and reverse, the end of the trend and further reversal can be assumed. However, such a signal requires confirmation, since there is a possibility of resumption of movement in the original direction.
Divergence and convergence. This is the most important signal of the MACD indicator. According to many traders, of all oscillators, it is the MACD that shows these states best of all. The main idea is that the situation on the chart is very easy to analyze. For divergence to appear, two consecutive highs must appear on the chart, the second higher than the first. With convergence, everything is the same, only it is formed in a bear market. That is, you need two consecutive lows on the chart and the same two lows on the MACD indicator chart, only the second must be higher than the first.
Closing line
The MACD oscillator is a great tool for both experienced and novice traders. For the latter, it is recommended to start working with a demo account. In addition to gaining experience, such an approach will help to develop certain statistics and work out optimal indicator settings. One should keep in mind that the larger the timeframe of the chart on which it is built, the fewer false signals there will be, but the more trading signals will be missed. Therefore, a “golden mean” is essential.
Finally, like any other indicator of TA, MACD requires confirmation. Do not make trading decisions based on the MACD alone, be sure to look for confirmation by other indicators.