Already have all the expertise necessary for trading? Use your knowledge and skills on the KickEXexchange! Make a profit today! It is important to understand the short-term and long-term moving averages (MA) for trading strategies, whether it be cryptocurrency or traditional assets. The crossover of these price-based curves forms either the “Golden Cross” or the “Death Cross” depending on the direction of the crossing.
These chart patterns predicted many of the worst economic downturns of the last century; for example, the Death Cross predicted the bear markets of 1929, 1938, 1974, and 2008. Importantly, they highlight the strength of the underlying trend, allowing traders to navigate the chaotic movements of cryptocurrency extreme intraday and day-to-day price volatility.
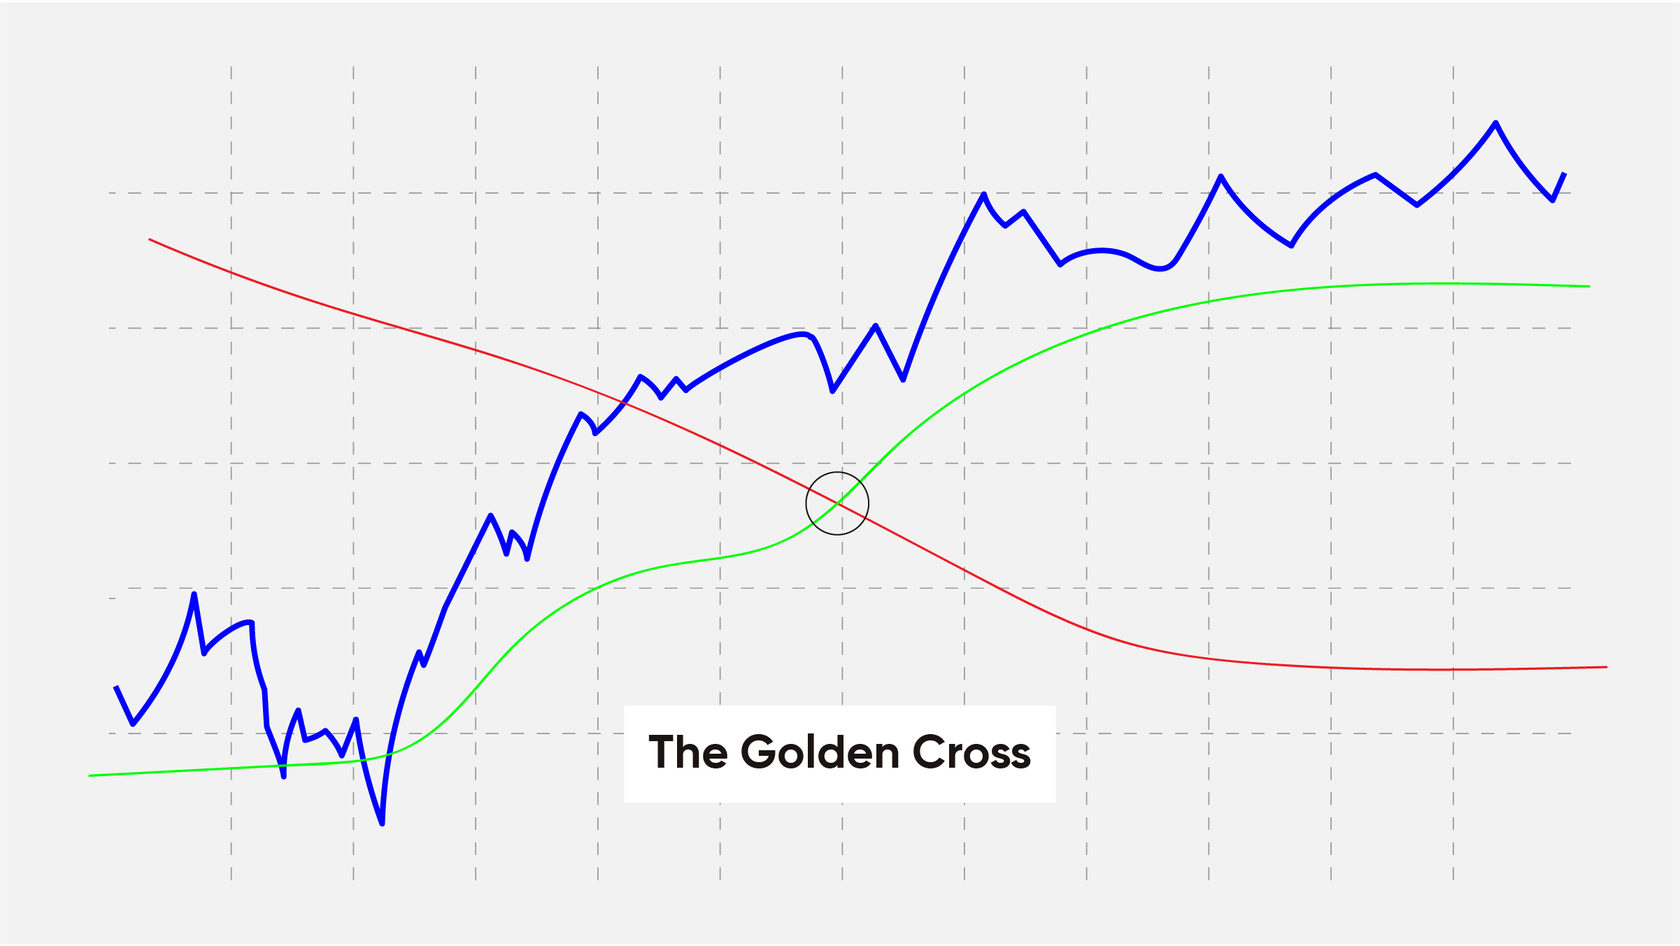
Golden Cross
A golden crossover occurs when a short-term moving average crosses a long-term moving average upward (see chart below), signaling traders to expect a strong bullish upward movement in the asset price.
There are two main requirements for the Gold Crossover. The first is the end of a sharp downtrend due to the exhaustion of sellers, which means less pressure from sellers in the market. The second requirement is for the short-term 50-day MA to cross up the long-term 200-day MA.
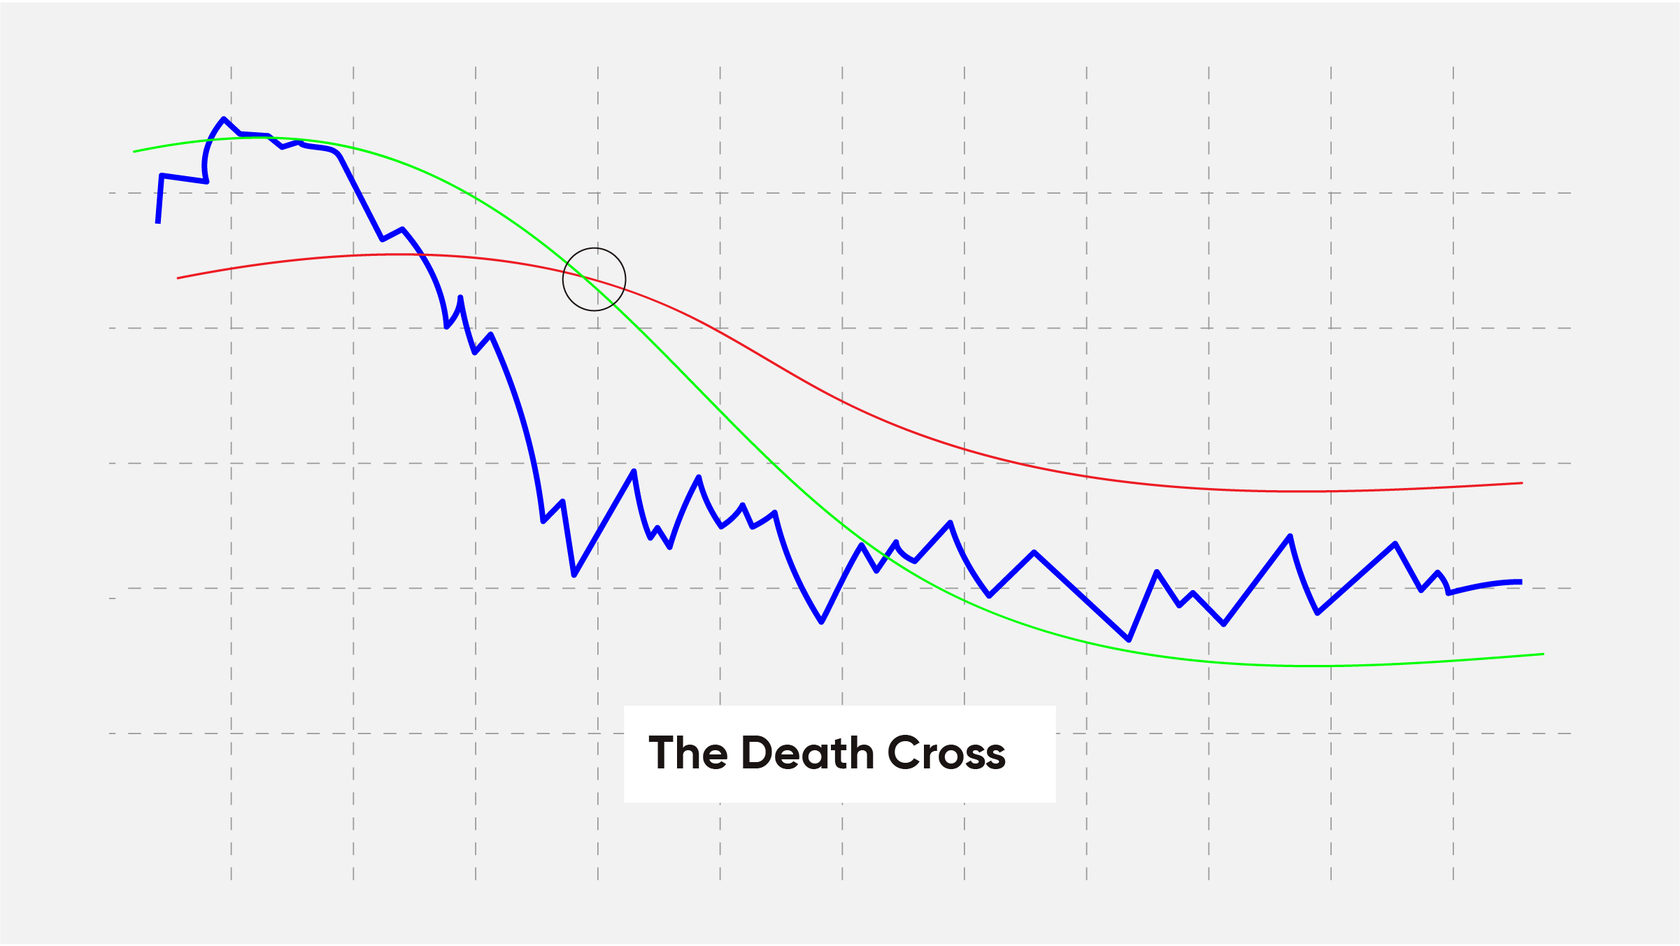
Death Cross
On the contrary, the Cross of Death is created by long-term buyer's exhaustion and is marked by a top-down crossover - the short-term 50-day MA goes below the long-term 200-day MA. As with the Golden Crossover, the Cross of Death is best defined using longer time frames as this trend is global. The trading rules for this strategy are similar. After the corresponding crossing, one needs to switch to a lower time frame and open a sell deal after receiving one of the signals. One can close a deal when the opposite signal appears - the Golden Cross.
Traders around the world use these moving averages in their analysis to determine the trend and direction of trades. Therefore, the 50-day and 200-day moving averages are a good guide to open buy trades when they cross up. This indicates that an uptrend is starting.
How to Trade?
If you follow the trend in the market, one can make big profits.
One of the options for taking profit using the Golden Cross strategy is to close a deal on the opposite signal - Death Cross. Thus, while the price is gradually moving in the right direction, you close the trade after confirming the trend change.
However, as with most chart analysis methods, signals on higher time frames are stronger than signals on lower time frames. The golden cross can appear in a weekly time frame while you are looking at the death cross occurring in an hourly time frame. Therefore, it is always a good idea to zoom out and look at the diagram as a whole, taking several values into account.
When trading gold crosses and death crosses, many traders need to pay special attention to trading volume. As with other chart patterns, the volume can be a powerful confirmation tool.
When the golden cross occurs, the long-term moving average can be seen as a potential support area. Conversely, when a death cross occurs, it can be seen as a potential area of resistance.
Closing Line
It is worth noting that these signals are not always perfect, but identifying and using Gold Crossovers and Death Crosses in conjunction with other signals can be an invaluable resource in helping you navigate the murky waters of the world's most volatile asset class.
Be careful when trading the Golden Cross during periods of consolidation because the market can trick you. Use the Golden Cross as a trend filter. Buy only when the 50-day moving average is above the 200-day MA. Exit the deal when the opposite signal appears - the Cross of Death. Trading according to the "Cross of Death" strategy has similar rules.