Japanese candlesticks are extremely famous in the technical analysis field. A slightly less popular innovation from the same country is the Ichimoku Cloud (Ichimoku Kinko Hyo) indicator. As the basis of a trading system, it helps to make a trading strategy more orderly and understandable. This trend tracking tool allows you to immediately identify the price action (even when there is a lot of data) with a few graphic elements.
Let us take a closer look at what Ichimoku Kinko Hyo clouds are, how to use them in trading, and what are the core elements one should know about.
The Ichimoku indicator as a complex technical analysis tool was introduced in 1968 by Tokyo observer Goichi Hosoda. The idea of the system was the ability to obtain a quick understanding of the trend mood, its dynamics, and strength, by interpreting all five components of the system in combination with the price dynamics in terms of the cyclical nature of their interaction, due to the group dynamics of human behavior (find more about the psychology of the market cycles).
The indicator uses 4 time intervals, which are determined by three indicator parameters.
Time intervals are the following:
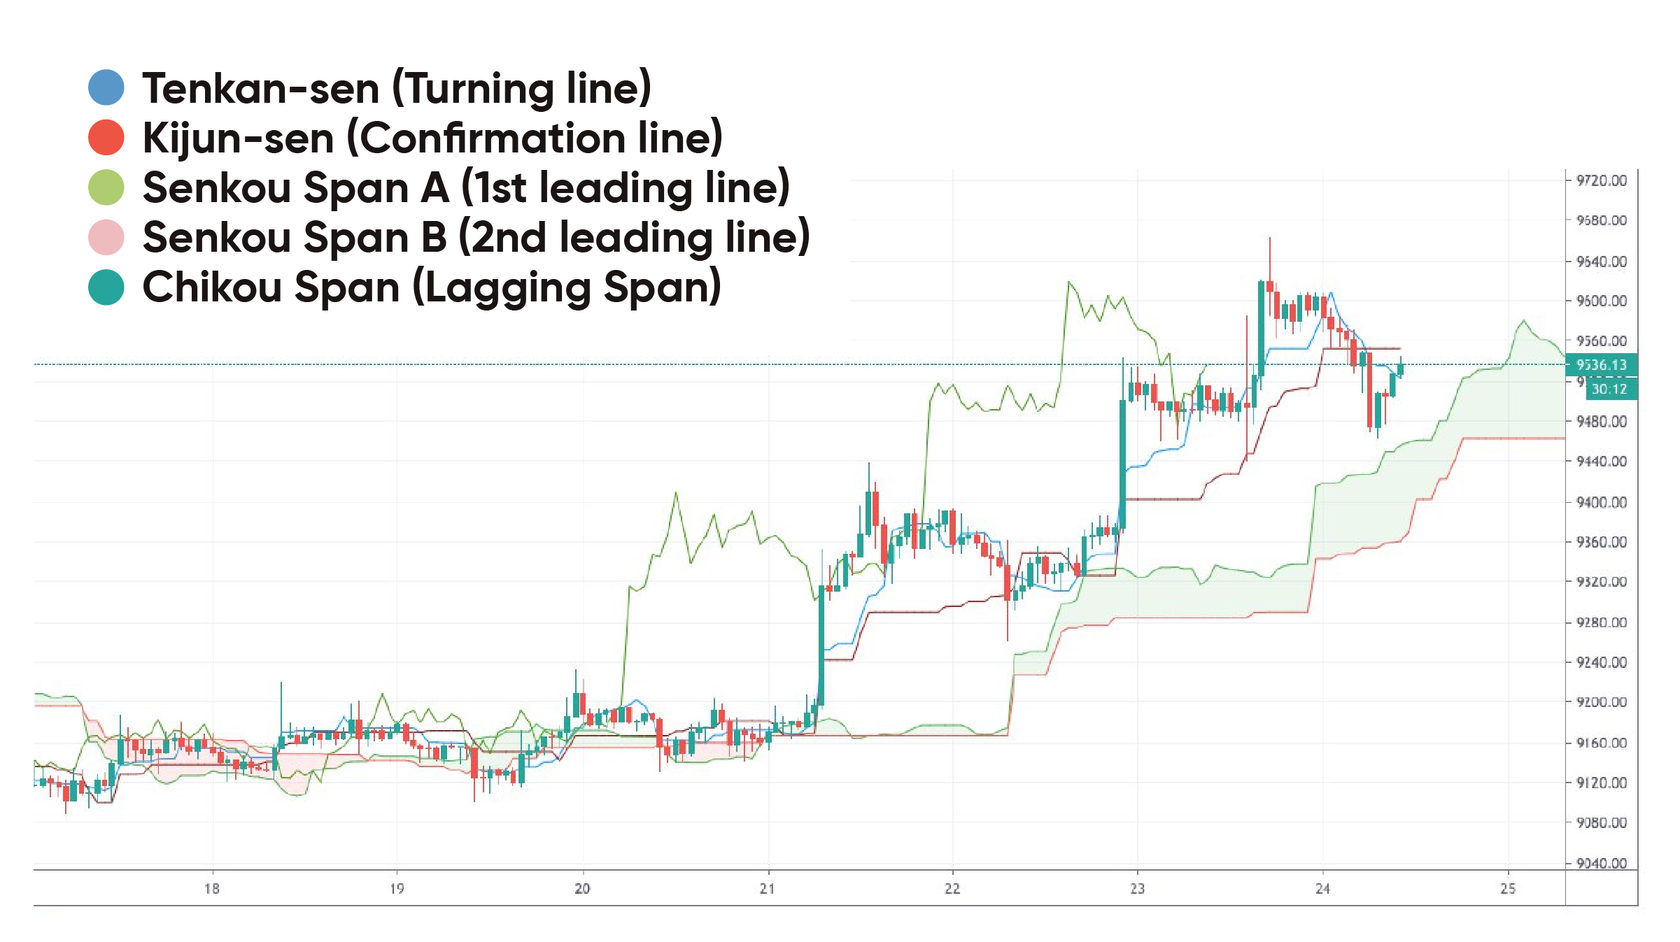
Tenkan-sen (Turning line) shows the average between the high and low of the price for the first time interval;
Kijun-sen (Confirmation line) shows the average between the high and low of the price for the second period;
Senkou Span A (1st leading line) shows the average of the distance between the previous two lines, shifted forward by the value of the second time interval;
Senkou Span B (2nd leading line) shows the average between the high and low of the price for the third time interval, shifted forward by the value of the second time interval.
Chikou Span (Lagging Span): the closing price of the current period projected 26 periods in the past.
The distance between the Senkou lines is hatched on the chart with a different color and is called the "cloud". Chinkou Span shows the closing price of the current candle, shifted in the past by the value of the second time interval.
Standard Calculations
Tenkan-sen turning line = (Highest high + Lowest low) / 2 over the last 9 periods;
Confirmation Kijun-sen = (Highest high + Lowest low) / 2 for the last 26 periods;
Leading Span 1 Senkou Span A = (Turning Line + Confirmation Line) / 2, plotted 26 periods ahead of the current moment;
Leading Span 2 Senkou Span B = (Highest High + Lowest Low) / 2 over the past 52 periods, plotted 26 periods ahead of the current moment;
Simple Usage Rules
Mentioned above lines are very similar to moving averages and are based on high and low prices. If the price is between Senkou Span A and B lines, the market is considered non-trend. The edges of the "cloud" form support and resistance levels.
If the price is above the cloud, then its upper line forms the first support level, and the second - the second support level;
If the price is under the cloud, then the lower line forms the first resistance level, and the upper line forms the second;
If the price breaks the lower line of the cloud down, this is a signal to sell, if the upper line is up, it is a signal to buy.
If the chart crosses the Senkou Span B line, it is the strongest signal to enter the market (especially if prices have gone beyond the cloud).
Kijun-sen is used as an indicator of market movement. If the price is above this line, prices are likely to continue to rise. When the price crosses this line, a further trend change is likely. Another option for using Kijun-sen is to give signals. A Tenkan-sen crossing above the Kijun-sen is a bullish sign, and a Tenkan-sen crossing below the Kijun-sen is a bearish sign.
Tenkan-sen is used as a market trend indicator. If this line rises, there is an uptrend. If it falls, there is a downtrend. When it goes horizontally, the market enters a flat.
Closing line
The Ichimoku indicator is one of the most complex classic indicators. At the same time, it is one of the most effective tools, representing a whole ready-made multi-element trading system.
Even though the indicator shows very good trading performance, it is not very popular among traders. This is most likely due to the complexity of the analysis of its signals and the period of work.